
AAVE/USDT Chart Analysis 📊📈
Current Price Action:
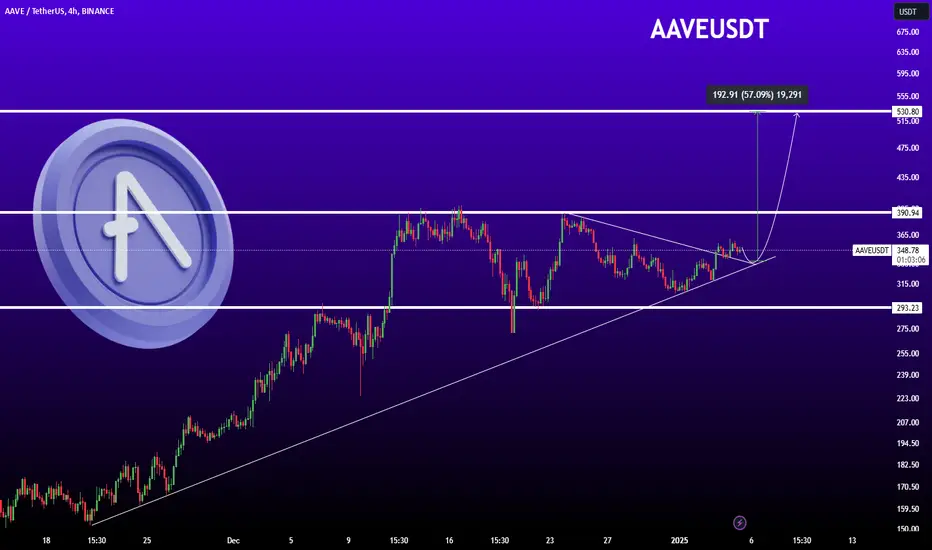
The current price of AAVE/USDT is around $349.58. The price has been moving inside a symmetrical triangle pattern, indicating a potential breakout soon. 📉📈
Key Support Levels:
$293.23: Strong support zone that has held previously. 🛡️
Ascending Trendline: Price is respecting the upward trendline, suggesting bullish momentum. 📈
Key Resistance Levels:
$390.94: The next resistance level that needs to be broken for further upward movement. 🚧
$530.80: Major resistance target after a confirmed breakout. 🎯
Breakout Scenario:
A breakout above the $390.94 level could trigger a bullish rally towards $530.80, marking a potential 57% gain. 🚀📊
Technical Indicators:
Symmetrical triangle pattern forming. 📐
Price holding above the ascending trendline. 📈
Volume could confirm the breakout direction. 📊
Summary:
AAVE/USDT is approaching a critical breakout point. A successful breakout above $390.94 could lead to a bullish surge toward $530.80, while failure to hold the trendline support may see a retest of the $293.23 level. ✅
⚠️ Risk Management Tip: Always use stop-loss and manage risk accordingly!
Current Price Action:
The current price of AAVE/USDT is around $349.58. The price has been moving inside a symmetrical triangle pattern, indicating a potential breakout soon. 📉📈
Key Support Levels:
$293.23: Strong support zone that has held previously. 🛡️
Ascending Trendline: Price is respecting the upward trendline, suggesting bullish momentum. 📈
Key Resistance Levels:
$390.94: The next resistance level that needs to be broken for further upward movement. 🚧
$530.80: Major resistance target after a confirmed breakout. 🎯
Breakout Scenario:
A breakout above the $390.94 level could trigger a bullish rally towards $530.80, marking a potential 57% gain. 🚀📊
Technical Indicators:
Symmetrical triangle pattern forming. 📐
Price holding above the ascending trendline. 📈
Volume could confirm the breakout direction. 📊
Summary:
AAVE/USDT is approaching a critical breakout point. A successful breakout above $390.94 could lead to a bullish surge toward $530.80, while failure to hold the trendline support may see a retest of the $293.23 level. ✅
⚠️ Risk Management Tip: Always use stop-loss and manage risk accordingly!

Penerbitan berkaitan
Penafian
Maklumat dan penerbitan adalah tidak bertujuan, dan tidak membentuk, nasihat atau cadangan kewangan, pelaburan, dagangan atau jenis lain yang diberikan atau disahkan oleh TradingView. Baca lebih dalam Terma Penggunaan.
Penerbitan berkaitan
Penafian
Maklumat dan penerbitan adalah tidak bertujuan, dan tidak membentuk, nasihat atau cadangan kewangan, pelaburan, dagangan atau jenis lain yang diberikan atau disahkan oleh TradingView. Baca lebih dalam Terma Penggunaan.