 ABFRL
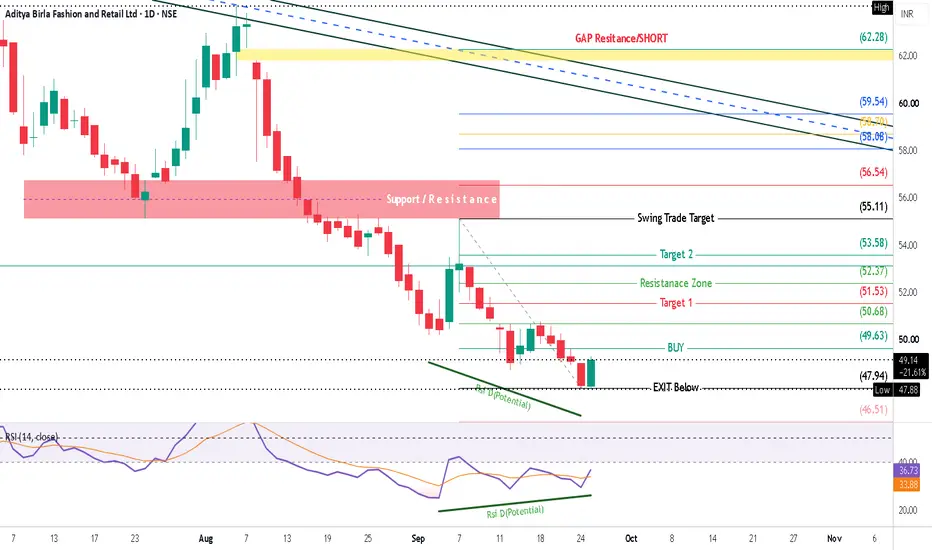
Aditya Birla Fashion and Retail Ltd (ABFRAL) is attempting to form a short-term base on the daily chart following a steep decline from its swing high above ₹62.00. Price recently established a lower low around ₹47.88, accompanied by an early RSI Bullish Divergence (Rsi D Potential) signal, as the RSI indicator printed a higher low against declining price levels. Currently trading at ₹49.14 (+2.25%), the stock is coiling below the BUY trigger level at ₹49.63, setting up a potential bounce toward immediate target zones and the major resistance block above.
🔹 PATTERN: POTENTIAL RSI DIVERGENCE & BASE CONSOLIDATION
• RSI Bullish Divergence (Rsi D Potential): Price formed a lower low at ₹47.88, while the 14-period RSI printed a higher low near 33.88–36.73, indicating diminishing downside momentum.
• Support / Resistance Zone: A major structural horizon band sits above between ₹55.11 and ₹56.54.
• Upper Resistance Lines: Descending trendlines and a blue dashed diagonal line frame upper overhead resistance between ₹58.08 and ₹59.54.
• GAP Resistance / SHORT Zone: Major yellow gap resistance box located at ₹62.00 – ₹62.28.
🟢 UPSIDE SCENARIO – BULLISH BREAKOUT
• Early Entry Trigger: Daily close above ₹49.63 (BUY)
• Target 1: ₹50.68 / ₹51.53 (+4.86% move from current price)
• Resistance Zone / Target 2: ₹52.37 / ₹53.58 (+9.04% move from current price)
• Swing Trade Target: ₹55.11 (+12.15% move from current price)
• Extended Targets: ₹56.54, ₹58.08, ₹58.70, ₹59.54, and ₹62.28 (GAP Resistance / SHORT)
🔴 DOWNSIDE SCENARIO – BEARISH BREAKDOWN
• Weakening Level: Rejection at or below ₹49.63
• Breakdown Level: Below the recent low at ₹47.88 (EXIT Below)
• Lower Extension Level: ₹46.51
• Invalidation: A daily candle close below ₹47.94 / ₹47.88 breaks the base support and invalidates the bullish divergence thesis.
🔹 MY BREAKOUT & EXIT RULE
If price crosses above a key resistance level (such as ₹49.63, ₹50.68, or ₹52.37) and makes a High above that level, but closes below that same level, I consider it a failed breakout/rejection and the BUYER NEEDS TO EXIT THE TRADE.
High above level + Close below level = Failed breakout → EXIT BUY TRADE.
🎯 MY TRADE ROADMAP
Bullish Breakout Path:
₹49.63 BUY Trigger
↓
₹50.68 / ₹51.53 Target 1
↓
₹52.37 / ₹53.58 Target 2 Resistance Zone
↓
₹55.11 Swing Trade Target
↓
₹56.54 Major Support / Resistance Zone
↓
₹58.08 / ₹59.54 Extended Resistance Lines
↓
₹62.00 – ₹62.28 GAP Resistance / SHORT Zone
Bearish Breakdown Path:
Rejection near ₹49.63 BUY Level
↓
₹49.14 Current Trading Level
↓
₹47.94 / ₹47.88 Low (EXIT Below / Invalidation)
↓
₹46.51 Lower Extension Target
🔑 MY VIEW
The preferred setup is a tactical bullish reversal attempt, provided price holds above key low support at ₹47.88 and achieves a confirmed daily close above ₹49.63. The emerging RSI bullish divergence indicates downside fatigue, opening up a potential recovery rally.
The bullish thesis gains validation once price trades and closes above ₹49.63, paving the way toward ₹50.68 – ₹51.53 (Target 1), ₹52.37 – ₹53.58 (Target 2), and the main Swing Trade Target at ₹55.11. The setup is invalidated if price fails to clear ₹49.63 and closes below the ₹47.88 base support line. A valid breakout requires a solid daily candle close above trigger levels, following strict risk execution if price gets rejected.
---
This is technical analysis based on chart structure, price levels, and visual patterns shown above. It is not financial advice. Market conditions can change and actual price movement may differ from projected levels.

Penafian
Maklumat dan penerbitan adalah tidak bertujuan, dan tidak membentuk, nasihat atau cadangan kewangan, pelaburan, dagangan atau jenis lain yang diberikan atau disahkan oleh TradingView. Baca lebih dalam Terma Penggunaan.
Penafian
Maklumat dan penerbitan adalah tidak bertujuan, dan tidak membentuk, nasihat atau cadangan kewangan, pelaburan, dagangan atau jenis lain yang diberikan atau disahkan oleh TradingView. Baca lebih dalam Terma Penggunaan.