
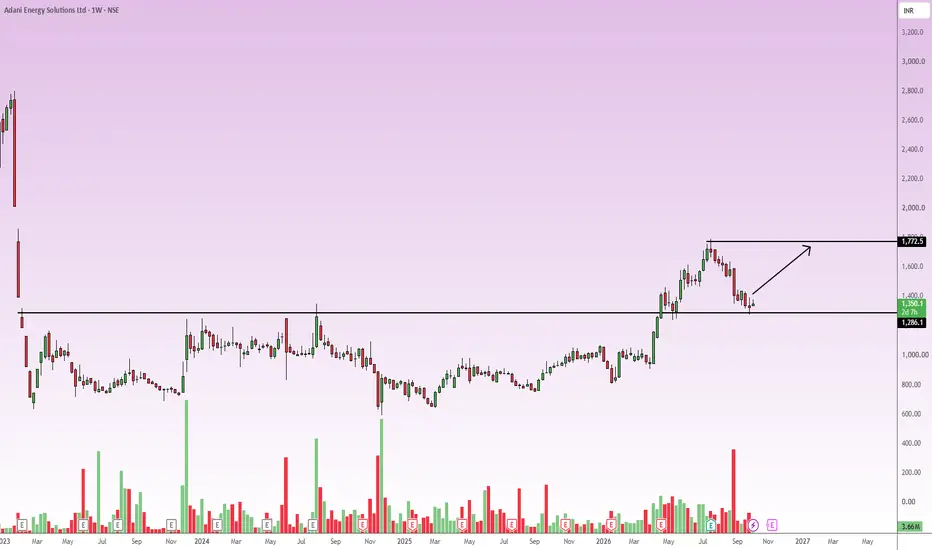
Adani Energy Solutions is showing a classic, high-probability bullish setup on the weekly timeframe.
After an extended period of consolidation, the price successfully broke out above the heavy resistance level at 1,286.
Currently, the stock has pulled back to retest this breakout level.
This is a textbook "resistance-turned-support" technical pattern.
The fact that this structure is forming on a weekly chart gives it significant weight.
The combination of the multi-month base breakout and the successful retest of the 1,286 level provides a strong bullish bias for a medium to long-term swing trade.
Trade Parameters:
Bias: Long / Bullish
Entry Zone: Current Market Price (approx. 1,350) down to the support line at 1,286. Accumulating in this zone offers a favorable risk-to-reward ratio.
Target (Take Profit): 1,772.50.
This aligns with the recent swing high marked on the chart, acting as the next major liquidity pool and resistance ceiling.
Stop Loss: A strict weekly close below 1,200.
Giving it a slight buffer below the 1,286 support line prevents getting stopped out by false intraday or intra-week wicks, while invalidating the trade if the support structurally fails.
Time Horizon: Medium to Long-term.
Because this is a 1W (Weekly) chart, this trade may take several weeks to a few months to play out and hit the target.
After an extended period of consolidation, the price successfully broke out above the heavy resistance level at 1,286.
Currently, the stock has pulled back to retest this breakout level.
This is a textbook "resistance-turned-support" technical pattern.
The fact that this structure is forming on a weekly chart gives it significant weight.
The combination of the multi-month base breakout and the successful retest of the 1,286 level provides a strong bullish bias for a medium to long-term swing trade.
Trade Parameters:
Bias: Long / Bullish
Entry Zone: Current Market Price (approx. 1,350) down to the support line at 1,286. Accumulating in this zone offers a favorable risk-to-reward ratio.
Target (Take Profit): 1,772.50.
This aligns with the recent swing high marked on the chart, acting as the next major liquidity pool and resistance ceiling.
Stop Loss: A strict weekly close below 1,200.
Giving it a slight buffer below the 1,286 support line prevents getting stopped out by false intraday or intra-week wicks, while invalidating the trade if the support structurally fails.
Time Horizon: Medium to Long-term.
Because this is a 1W (Weekly) chart, this trade may take several weeks to a few months to play out and hit the target.

Penafian
Maklumat dan penerbitan adalah tidak bertujuan, dan tidak membentuk, nasihat atau cadangan kewangan, pelaburan, dagangan atau jenis lain yang diberikan atau disahkan oleh TradingView. Baca lebih dalam Terma Penggunaan.
Penafian
Maklumat dan penerbitan adalah tidak bertujuan, dan tidak membentuk, nasihat atau cadangan kewangan, pelaburan, dagangan atau jenis lain yang diberikan atau disahkan oleh TradingView. Baca lebih dalam Terma Penggunaan.