
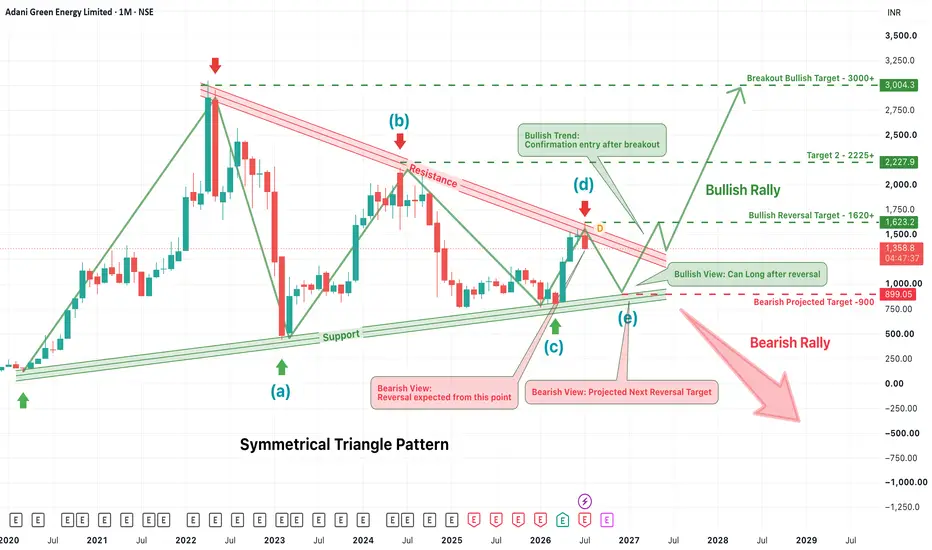
Adani Green Energy has reached one of the most decisive zones on its long-term monthly chart. After respecting its rising support trendline for several years, the stock is now trading near the intersection of a long-term ascending support and a falling resistance trendline. This creates a high-probability decision point where the next major trend is likely to begin.
The chart also illustrates a possible ABCDE corrective pattern, with waves (a), (b), (c), and (d) already completed. If the current move forms the final (e) wave while holding the long-term support, the stock could complete its correction and prepare for a fresh bullish cycle. However, failure to hold this support would invalidate the bullish setup and open the door for a deeper correction.
🟢 Bullish Scenario
The bullish case remains valid as long as the long-term rising support continues to hold. A decisive breakout above the falling resistance trendline, preferably with strong monthly closing strength and increased volume, would confirm that buyers have regained control.
Bullish Targets:
Target 1: ₹1,620+
Target 2: ₹2,225+
Long-Term Breakout Target: ₹3,000+
A confirmed breakout could mark the beginning of the next long-term uptrend, offering significant upside potential over the coming quarters.
🔴 Bearish Scenario
If the stock fails to sustain above the rising support trendline and breaks below the highlighted support zone, the current bullish structure would weaken considerably. Such a breakdown would indicate that sellers remain in control and the correction is not yet complete.
Bearish Target:
Initial Downside Zone: ₹900
A sustained move below this support could trigger fresh selling pressure and delay any long-term bullish reversal.
🟡 Consolidation Trading Opportunity
Until Adani Green gives a decisive breakout or breakdown, the stock is likely to remain in a consolidation phase between the rising support and falling resistance trendlines. During this period, swing traders can capitalize on short-term price movements by buying near the support zone and booking profits near the resistance zone, while maintaining strict stop-loss discipline.
However, traders should avoid taking aggressive positional bets until the stock confirms its next major direction. A breakout above the resistance could trigger a fresh bullish rally, whereas a breakdown below support may lead to a deeper correction. Until then, range-bound (consolidation) trading remains the preferred strategy.
Trading Strategy
This is not an ideal level to chase aggressively. Conservative traders should wait for a confirmed breakout above the descending resistance before initiating long positions. On the other hand, a breakdown below the rising support would shift the technical bias to bearish and warrant caution.
Conclusion
Adani Green is approaching a make-or-break technical zone where both bullish and bearish possibilities exist. The next major move will likely be decided by whether price breaks above the falling resistance or falls below the long-term rising support. Until confirmation arrives, traders should remain patient and allow the market to reveal its direction.
The chart also illustrates a possible ABCDE corrective pattern, with waves (a), (b), (c), and (d) already completed. If the current move forms the final (e) wave while holding the long-term support, the stock could complete its correction and prepare for a fresh bullish cycle. However, failure to hold this support would invalidate the bullish setup and open the door for a deeper correction.
🟢 Bullish Scenario
The bullish case remains valid as long as the long-term rising support continues to hold. A decisive breakout above the falling resistance trendline, preferably with strong monthly closing strength and increased volume, would confirm that buyers have regained control.
Bullish Targets:
Target 1: ₹1,620+
Target 2: ₹2,225+
Long-Term Breakout Target: ₹3,000+
A confirmed breakout could mark the beginning of the next long-term uptrend, offering significant upside potential over the coming quarters.
🔴 Bearish Scenario
If the stock fails to sustain above the rising support trendline and breaks below the highlighted support zone, the current bullish structure would weaken considerably. Such a breakdown would indicate that sellers remain in control and the correction is not yet complete.
Bearish Target:
Initial Downside Zone: ₹900
A sustained move below this support could trigger fresh selling pressure and delay any long-term bullish reversal.
🟡 Consolidation Trading Opportunity
Until Adani Green gives a decisive breakout or breakdown, the stock is likely to remain in a consolidation phase between the rising support and falling resistance trendlines. During this period, swing traders can capitalize on short-term price movements by buying near the support zone and booking profits near the resistance zone, while maintaining strict stop-loss discipline.
However, traders should avoid taking aggressive positional bets until the stock confirms its next major direction. A breakout above the resistance could trigger a fresh bullish rally, whereas a breakdown below support may lead to a deeper correction. Until then, range-bound (consolidation) trading remains the preferred strategy.
Trading Strategy
This is not an ideal level to chase aggressively. Conservative traders should wait for a confirmed breakout above the descending resistance before initiating long positions. On the other hand, a breakdown below the rising support would shift the technical bias to bearish and warrant caution.
Conclusion
Adani Green is approaching a make-or-break technical zone where both bullish and bearish possibilities exist. The next major move will likely be decided by whether price breaks above the falling resistance or falls below the long-term rising support. Until confirmation arrives, traders should remain patient and allow the market to reveal its direction.

📈 Trade Smarter with TradZoo!
📣 Telegram: t.me/tradzooIndex
📣 Forex Telegram: t.me/tradzoofx
📲 Mobile App: tradzoo.com/download
📲 Forex App:tradzoo.com/forex/download
🔗 Website: bit.ly/tradzoopage
📣 Telegram: t.me/tradzooIndex
📣 Forex Telegram: t.me/tradzoofx
📲 Mobile App: tradzoo.com/download
📲 Forex App:tradzoo.com/forex/download
🔗 Website: bit.ly/tradzoopage
Penafian
Maklumat dan penerbitan adalah tidak bertujuan, dan tidak membentuk, nasihat atau cadangan kewangan, pelaburan, dagangan atau jenis lain yang diberikan atau disahkan oleh TradingView. Baca lebih dalam Terma Penggunaan.
📈 Trade Smarter with TradZoo!
📣 Telegram: t.me/tradzooIndex
📣 Forex Telegram: t.me/tradzoofx
📲 Mobile App: tradzoo.com/download
📲 Forex App:tradzoo.com/forex/download
🔗 Website: bit.ly/tradzoopage
📣 Telegram: t.me/tradzooIndex
📣 Forex Telegram: t.me/tradzoofx
📲 Mobile App: tradzoo.com/download
📲 Forex App:tradzoo.com/forex/download
🔗 Website: bit.ly/tradzoopage
Penafian
Maklumat dan penerbitan adalah tidak bertujuan, dan tidak membentuk, nasihat atau cadangan kewangan, pelaburan, dagangan atau jenis lain yang diberikan atau disahkan oleh TradingView. Baca lebih dalam Terma Penggunaan.