
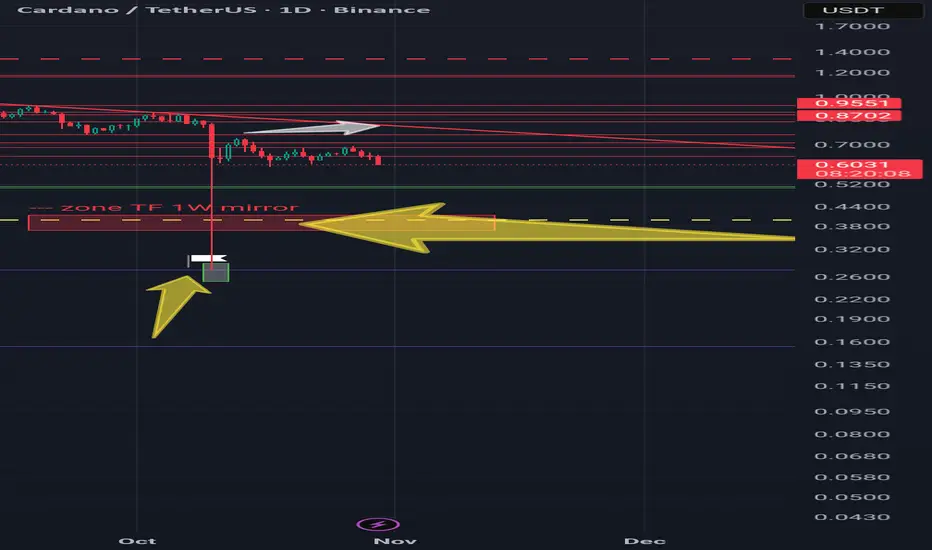
Nothing special, after October 10, we found a "bottom" in this cycle, where it will probably move in a chaotic direction, shedding shorts and longs on its way. The yellow dotted line indicates the area where a "turn" is possible (it is possible to make some decisions, political or drastic regulatory changes or in that spirit)
Red showed resistance zones in case of a possible reversal. And a break of the negative trend on TF 1D.There is also weak support, which may act as a "hope" zone with a possible slight increase and a rapid decline in price to the lows that we have already tested on October 10, and clearly rested in the support zone.
But I wouldn't be surprised if we're in the near future, it will bounce back significantly below October 10th.
Red showed resistance zones in case of a possible reversal. And a break of the negative trend on TF 1D.There is also weak support, which may act as a "hope" zone with a possible slight increase and a rapid decline in price to the lows that we have already tested on October 10, and clearly rested in the support zone.
But I wouldn't be surprised if we're in the near future, it will bounce back significantly below October 10th.

Penafian
Maklumat dan penerbitan adalah tidak bertujuan, dan tidak membentuk, nasihat atau cadangan kewangan, pelaburan, dagangan atau jenis lain yang diberikan atau disahkan oleh TradingView. Baca lebih dalam Terma Penggunaan.
Penafian
Maklumat dan penerbitan adalah tidak bertujuan, dan tidak membentuk, nasihat atau cadangan kewangan, pelaburan, dagangan atau jenis lain yang diberikan atau disahkan oleh TradingView. Baca lebih dalam Terma Penggunaan.