
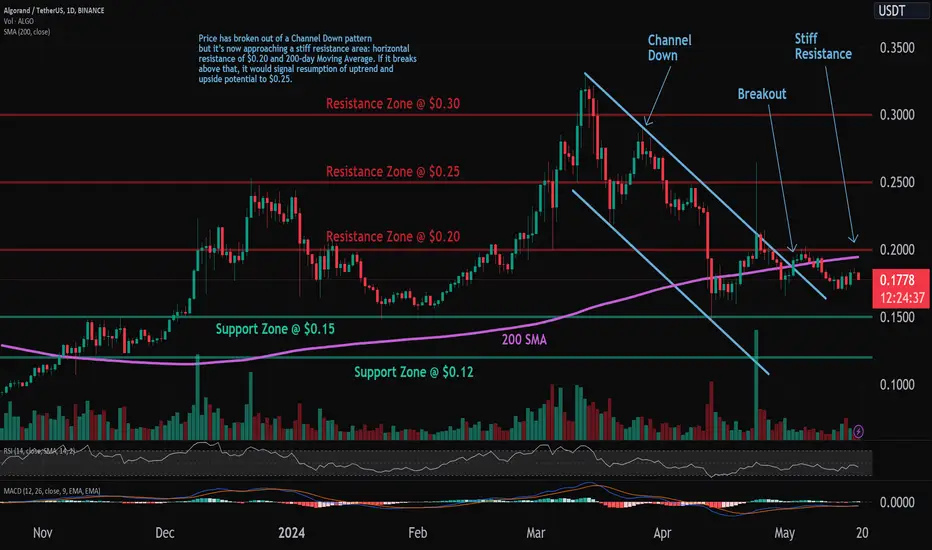
Trade setup: Trends are mixed to down. Price has broken out of a Channel Down pattern but it’s now approaching a stiff resistance area: horizontal resistance of $0.20 and 200-day Moving Average. If it breaks above that, it would signal resumption of uptrend and upside potential to $0.25.
Trend: Downtrend across all time horizons (Short- Medium- and Long-Term).
Momentum is Mixed as MACD Line is above MACD Signal Line (Bullish) but RSI ~ 50 (Neutral).
Support and Resistance: Nearest Support Zone is $0.15, then $0.12. The nearest Resistance Zone is $0.20, then $0.25 and $0.30.
Trend: Downtrend across all time horizons (Short- Medium- and Long-Term).
Momentum is Mixed as MACD Line is above MACD Signal Line (Bullish) but RSI ~ 50 (Neutral).
Support and Resistance: Nearest Support Zone is $0.15, then $0.12. The nearest Resistance Zone is $0.20, then $0.25 and $0.30.

Penafian
Maklumat dan penerbitan adalah tidak bertujuan, dan tidak membentuk, nasihat atau cadangan kewangan, pelaburan, dagangan atau jenis lain yang diberikan atau disahkan oleh TradingView. Baca lebih dalam Terma Penggunaan.
Penafian
Maklumat dan penerbitan adalah tidak bertujuan, dan tidak membentuk, nasihat atau cadangan kewangan, pelaburan, dagangan atau jenis lain yang diberikan atau disahkan oleh TradingView. Baca lebih dalam Terma Penggunaan.