
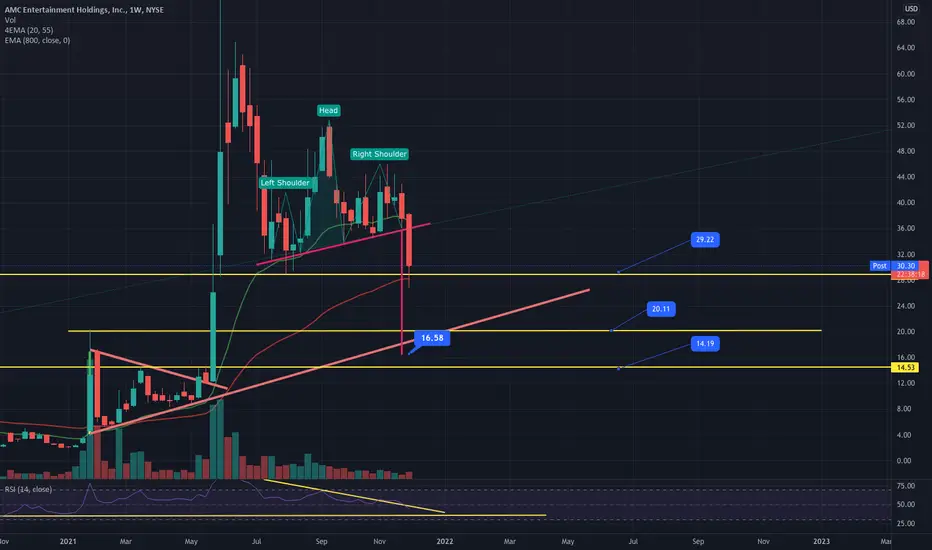
We can now see a clear head and shoulders pattern executed on the weekly time frame. The stock has bounced slightly off the 55 weekly moving average currently finding support at around $29 which was the previous swing low from August. The technical target from the head and shoulders pattern would bring the price to around $16.
Levels of support :
If we fail to hold support at $29 and lose the weekly 55 moving average we have $20 which is a previous swing high as labeled (top of previous pendant wick) and $14.33 ( previous swing high from first pendant.
Levels of support :
If we fail to hold support at $29 and lose the weekly 55 moving average we have $20 which is a previous swing high as labeled (top of previous pendant wick) and $14.33 ( previous swing high from first pendant.

Penafian
Maklumat dan penerbitan adalah tidak bertujuan, dan tidak membentuk, nasihat atau cadangan kewangan, pelaburan, dagangan atau jenis lain yang diberikan atau disahkan oleh TradingView. Baca lebih dalam Terma Penggunaan.
Penafian
Maklumat dan penerbitan adalah tidak bertujuan, dan tidak membentuk, nasihat atau cadangan kewangan, pelaburan, dagangan atau jenis lain yang diberikan atau disahkan oleh TradingView. Baca lebih dalam Terma Penggunaan.