
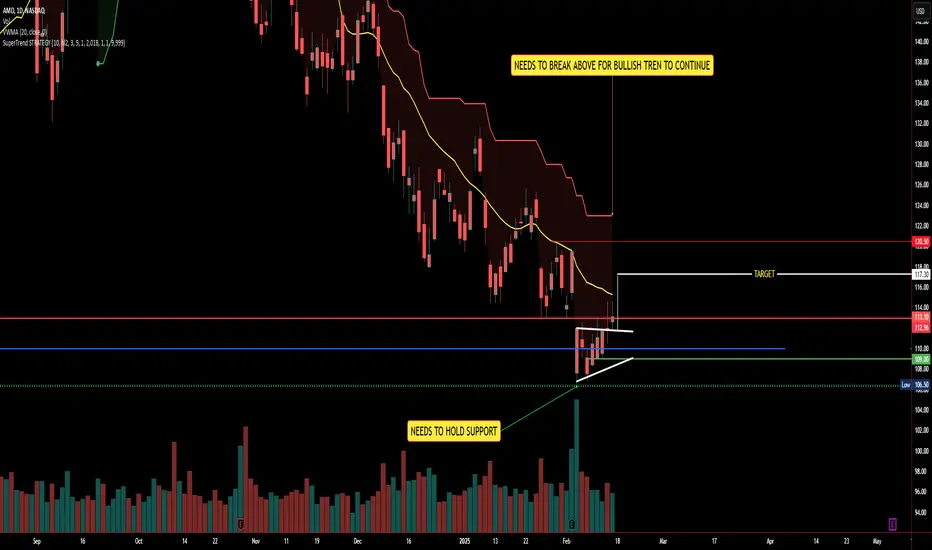
AMD is forming a potential ascending triangle pattern on the daily chart, signaling a possible breakout if momentum continues.
🔍 Key Levels to Watch:
✅ Support Zone: The stock needs to hold above the $108-$109 range for the bullish setup to remain intact.
✅ Breakout Level: A push above $114 could confirm upside continuation.
✅ Target Levels: If AMD breaks out, we could see a move toward $117-$120.50 in the near term.
The yellow 20-day WMA and SuperTrend resistance are key hurdles. A strong close above them would confirm a shift in momentum.
💬 What’s your outlook on AMD? Do you think it can break out, or will it face resistance? Drop your thoughts below! 👇
🔍 Key Levels to Watch:
✅ Support Zone: The stock needs to hold above the $108-$109 range for the bullish setup to remain intact.
✅ Breakout Level: A push above $114 could confirm upside continuation.
✅ Target Levels: If AMD breaks out, we could see a move toward $117-$120.50 in the near term.
The yellow 20-day WMA and SuperTrend resistance are key hurdles. A strong close above them would confirm a shift in momentum.
💬 What’s your outlook on AMD? Do you think it can break out, or will it face resistance? Drop your thoughts below! 👇

Penerbitan berkaitan
Penafian
Maklumat dan penerbitan adalah tidak bertujuan, dan tidak membentuk, nasihat atau cadangan kewangan, pelaburan, dagangan atau jenis lain yang diberikan atau disahkan oleh TradingView. Baca lebih dalam Terma Penggunaan.
Penerbitan berkaitan
Penafian
Maklumat dan penerbitan adalah tidak bertujuan, dan tidak membentuk, nasihat atau cadangan kewangan, pelaburan, dagangan atau jenis lain yang diberikan atau disahkan oleh TradingView. Baca lebih dalam Terma Penggunaan.