
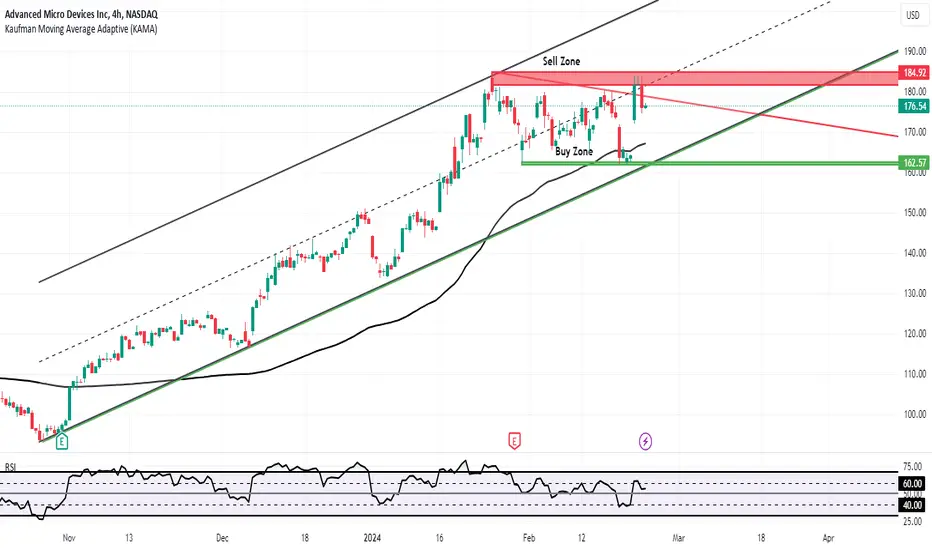
AMD stock appears to have lacked strong upward momentum as it couldn't close above the red signal on the daily chart. If the daily chart closes below the red signal again, the initial reaction area could be the Kaufman Moving Average at 167.15. On daily closings above the red signal, it may experience some bounce from the middle band of the channel; however, a daily close above the channel might indicate a potential upward momentum.
WARNING: THIS ANALYSIS IS NOT INVESTMENT ADVICE. CONSIDER YOUR RISK TOLERANCE AND FINANCIAL SITUATION BEFORE MAKING DECISIONS. PAST PERFORMANCE DOES NOT GUARANTEE FUTURE RESULTS; THIS IS PURELY AN OPINION. INVEST WISELY AND CONDUCT THOROUGH RESEARCH.
WARNING: THIS ANALYSIS IS NOT INVESTMENT ADVICE. CONSIDER YOUR RISK TOLERANCE AND FINANCIAL SITUATION BEFORE MAKING DECISIONS. PAST PERFORMANCE DOES NOT GUARANTEE FUTURE RESULTS; THIS IS PURELY AN OPINION. INVEST WISELY AND CONDUCT THOROUGH RESEARCH.

Penafian
Maklumat dan penerbitan adalah tidak bertujuan, dan tidak membentuk, nasihat atau cadangan kewangan, pelaburan, dagangan atau jenis lain yang diberikan atau disahkan oleh TradingView. Baca lebih dalam Terma Penggunaan.
Penafian
Maklumat dan penerbitan adalah tidak bertujuan, dan tidak membentuk, nasihat atau cadangan kewangan, pelaburan, dagangan atau jenis lain yang diberikan atau disahkan oleh TradingView. Baca lebih dalam Terma Penggunaan.