
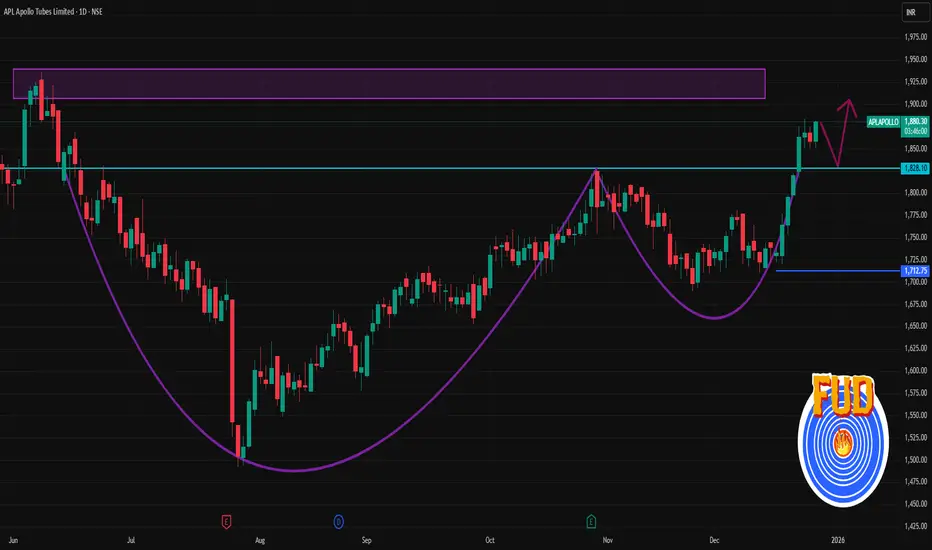
🔹 Recent Price Context (Indicative)
The stock is trading around ~₹1,850‑₹1,880 levels (recent session range) with a 52‑week high near ₹1,936 and low near ₹1,273.
📊 Intraday / 1‑Day Key Levels (Support & Resistance)
📈 Resistance Levels
These can act as intraday ceilings where price may stall or reverse:
R1: ~₹1,871‑₹1,875 area
R2: ~₹1,885‑₹1,900
R3: ~₹1,895‑₹1,915
(based on pivot analysis around recent highs/multiple technical sources)
📉 Support Levels
These are levels where price might find buying interest on a dip:
S1: ~₹1,840‑₹1,848
S2: ~₹1,830‑₹1,837
S3: ~₹1,825‑₹1,830
(short‑term pivot supports from multiple intraday pivot estimates)
Notes on pivots (classic & Fibonacci):
Pivot mid‑point often lies near ~₹1,860–₹1,865 on the day.
📍 Intraday Trading Tips
✔ Above the pivot (~₹1,860) → bullish bias for the day
✔ Below the pivot → intraday sellers may dominate
✔ Watch volume spikes at support or resistance for breakout confirmation.
Pivot and MA signals show a positive short‑term trend.
The stock is trading around ~₹1,850‑₹1,880 levels (recent session range) with a 52‑week high near ₹1,936 and low near ₹1,273.
📊 Intraday / 1‑Day Key Levels (Support & Resistance)
📈 Resistance Levels
These can act as intraday ceilings where price may stall or reverse:
R1: ~₹1,871‑₹1,875 area
R2: ~₹1,885‑₹1,900
R3: ~₹1,895‑₹1,915
(based on pivot analysis around recent highs/multiple technical sources)
📉 Support Levels
These are levels where price might find buying interest on a dip:
S1: ~₹1,840‑₹1,848
S2: ~₹1,830‑₹1,837
S3: ~₹1,825‑₹1,830
(short‑term pivot supports from multiple intraday pivot estimates)
Notes on pivots (classic & Fibonacci):
Pivot mid‑point often lies near ~₹1,860–₹1,865 on the day.
📍 Intraday Trading Tips
✔ Above the pivot (~₹1,860) → bullish bias for the day
✔ Below the pivot → intraday sellers may dominate
✔ Watch volume spikes at support or resistance for breakout confirmation.
Pivot and MA signals show a positive short‑term trend.

Contact Knowledgehub for a detailed consultation: Dm on WhatsApp: [wa.link/a2o0kz]-
Phone No: [+91 93102 26243]-
Email: [tradingviewknowledgehub@gmail.com]---
-- Let’s achieve success together!
Phone No: [+91 93102 26243]-
Email: [tradingviewknowledgehub@gmail.com]---
-- Let’s achieve success together!
Penerbitan berkaitan
Penafian
Maklumat dan penerbitan adalah tidak bertujuan, dan tidak membentuk, nasihat atau cadangan kewangan, pelaburan, dagangan atau jenis lain yang diberikan atau disahkan oleh TradingView. Baca lebih dalam Terma Penggunaan.
Contact Knowledgehub for a detailed consultation: Dm on WhatsApp: [wa.link/a2o0kz]-
Phone No: [+91 93102 26243]-
Email: [tradingviewknowledgehub@gmail.com]---
-- Let’s achieve success together!
Phone No: [+91 93102 26243]-
Email: [tradingviewknowledgehub@gmail.com]---
-- Let’s achieve success together!
Penerbitan berkaitan
Penafian
Maklumat dan penerbitan adalah tidak bertujuan, dan tidak membentuk, nasihat atau cadangan kewangan, pelaburan, dagangan atau jenis lain yang diberikan atau disahkan oleh TradingView. Baca lebih dalam Terma Penggunaan.