
Just charts
Nota
ARK ETF divided in channels:Nota
H4 chart:Nota
H1 range breakout:Nota
If you have a growth stock portfolio you can't avoid watching the ark etf. I analyzed the ETF for you. And do you notice something? If you have a growth stock portfolio, it reflects your portfolio very well. I use the ark etf as a benchmark index for my growth values.You can see important levels in the chart. I used different timeframes. A quick look at the chart:
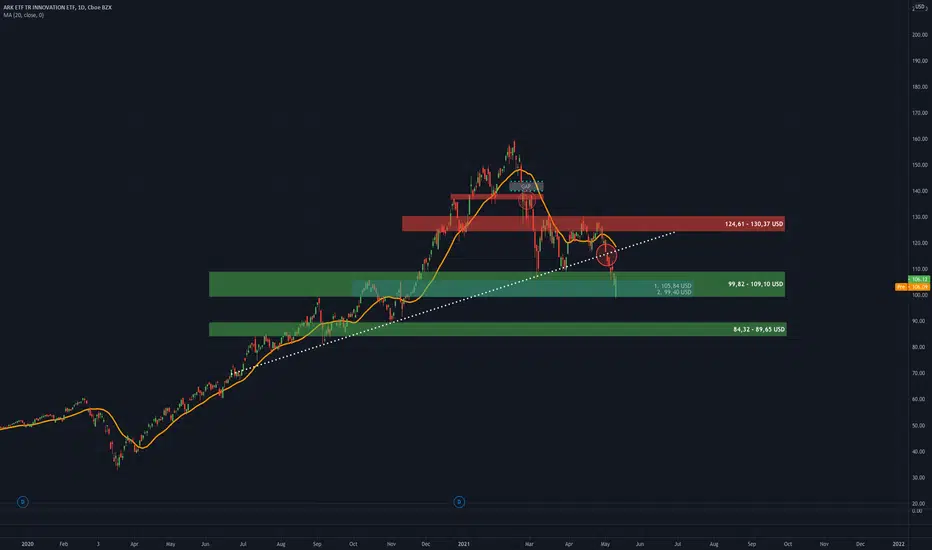
D1: The daily shows a trend break. The break below the dashed & strong trendline was a first bearish signal. We are currently in the support area, but it is under great pressure.
H10: I used the h10 chart to draw important channels. The tertiary channel has signaled a danger to me. At a certain point, these become a short possibility. Why? Because the ETF was way too hyped. So remember: tertiary channels are dangerous in the near term. Pullbacks were to be expected. Because: a trend is not possible forever.
H4: In the H4 you can see the exact levels again.
H1: I included fibo in H1.

Penafian
Maklumat dan penerbitan adalah tidak bertujuan, dan tidak membentuk, nasihat atau cadangan kewangan, pelaburan, dagangan atau jenis lain yang diberikan atau disahkan oleh TradingView. Baca lebih dalam Terma Penggunaan.
Penafian
Maklumat dan penerbitan adalah tidak bertujuan, dan tidak membentuk, nasihat atau cadangan kewangan, pelaburan, dagangan atau jenis lain yang diberikan atau disahkan oleh TradingView. Baca lebih dalam Terma Penggunaan.