
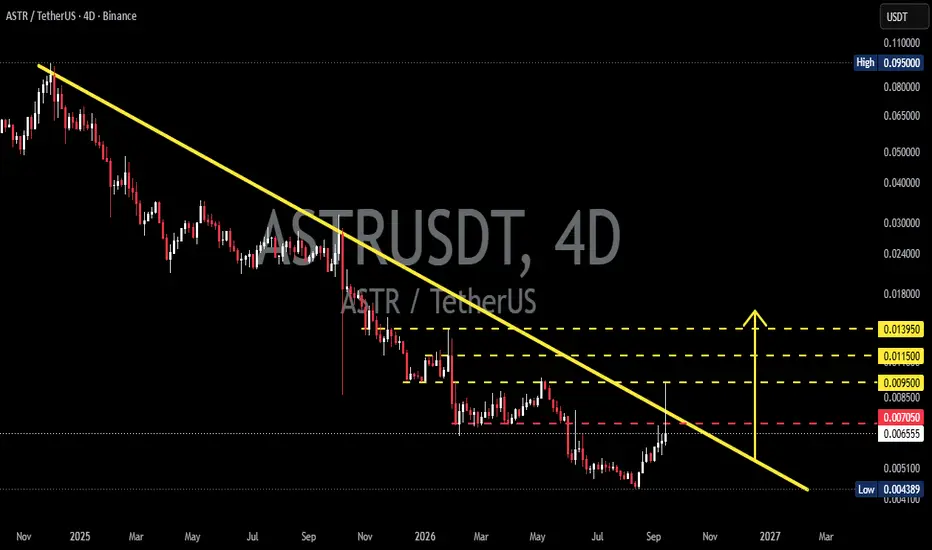
The ASTR/USDT chart shows a Descending Trendline formed from the peak area around 0.09500 USDT, continuing to limit price movement through a series of Lower Highs.
📉 As long as the price remains below the yellow trendline, the medium- to long-term structure continues to show bearish pressure.
However, there is an interesting development as the price has rebounded from the Low around 0.004389 USDT and is now moving upward toward an important resistance area.
---
🟡 Descending Trendline Structure
🔻 Dynamic Resistance: The yellow trendline acts as the primary resistance that continues to pressure the price.
📉 Lower Highs: Several previous price peaks failed to break above the trendline, strengthening the validity of the Descending Trendline.
📈 Rebound: The price successfully bounced from the 0.004389 USDT area, indicating a buyer response at lower levels.
⚠️ Key Area: The price is currently around 0.006542 USDT, with the nearest horizontal resistance at 0.007050 USDT.
---
🟢 Bullish Scenario
🚀 The bullish scenario becomes more interesting if ASTR manages to break and confirm a breakout above the Descending Trendline.
📈 A valid breakout could indicate that bearish pressure is beginning to weaken and that the price structure may potentially shift.
🎯 Key resistance/target levels to watch:
🟢 0.007050 USDT — First horizontal resistance
🟡 0.009500 USDT — Next target/resistance
🟡 0.011500 USDT — Next resistance
🟡 0.013950 USDT — Major resistance zone on the chart
🔥 If the price successfully breaks above 0.013950 USDT, the upward structure would demonstrate significantly stronger momentum compared with the current condition.
⚠️ Important: The breakout should preferably be confirmed by a 4D candle close above the trendline, rather than relying only on a temporary wick.
---
🔴 Bearish Scenario
⚠️ The bearish scenario remains valid if the price fails to break the Descending Trendline and comes under renewed selling pressure.
📉 Rejection from the trendline could maintain the Lower High structure and potentially continue the downward trend.
🔻 If 0.007050 USDT turns back into resistance and the price moves lower, attention could shift toward:
🔴 0.006542 USDT — Current price area
🔻 0.005100 USDT — Next support
🟥 0.004389 USDT — Major Low on the chart
💥 Losing the 0.004389 USDT area would indicate that the previous rebound failed to hold and that bearish pressure is once again dominating.
---
⚖️ Conclusion
📊 ASTR/USDT is currently at an important stage within the Descending Trendline structure.
🔻 Bearish: As long as the price remains below the Descending Trendline, the bearish structure has not been fully invalidated.
🟢 Bullish: A breakout and confirmation above the Descending Trendline could open the way toward 0.007050 → 0.009500 → 0.011500 → 0.013950 USDT.
👀 The most important levels to watch:
0.007050 USDT + Descending Trendline
🚨 Do not consider a breakout valid based on a single wick alone. Candle confirmation and the price's ability to hold the breakout area will be important factors in determining whether the breakout is genuine or merely a false breakout.
#ASTR #ASTRUSDT #Crypto
📉 As long as the price remains below the yellow trendline, the medium- to long-term structure continues to show bearish pressure.
However, there is an interesting development as the price has rebounded from the Low around 0.004389 USDT and is now moving upward toward an important resistance area.
---
🟡 Descending Trendline Structure
🔻 Dynamic Resistance: The yellow trendline acts as the primary resistance that continues to pressure the price.
📉 Lower Highs: Several previous price peaks failed to break above the trendline, strengthening the validity of the Descending Trendline.
📈 Rebound: The price successfully bounced from the 0.004389 USDT area, indicating a buyer response at lower levels.
⚠️ Key Area: The price is currently around 0.006542 USDT, with the nearest horizontal resistance at 0.007050 USDT.
---
🟢 Bullish Scenario
🚀 The bullish scenario becomes more interesting if ASTR manages to break and confirm a breakout above the Descending Trendline.
📈 A valid breakout could indicate that bearish pressure is beginning to weaken and that the price structure may potentially shift.
🎯 Key resistance/target levels to watch:
🟢 0.007050 USDT — First horizontal resistance
🟡 0.009500 USDT — Next target/resistance
🟡 0.011500 USDT — Next resistance
🟡 0.013950 USDT — Major resistance zone on the chart
🔥 If the price successfully breaks above 0.013950 USDT, the upward structure would demonstrate significantly stronger momentum compared with the current condition.
⚠️ Important: The breakout should preferably be confirmed by a 4D candle close above the trendline, rather than relying only on a temporary wick.
---
🔴 Bearish Scenario
⚠️ The bearish scenario remains valid if the price fails to break the Descending Trendline and comes under renewed selling pressure.
📉 Rejection from the trendline could maintain the Lower High structure and potentially continue the downward trend.
🔻 If 0.007050 USDT turns back into resistance and the price moves lower, attention could shift toward:
🔴 0.006542 USDT — Current price area
🔻 0.005100 USDT — Next support
🟥 0.004389 USDT — Major Low on the chart
💥 Losing the 0.004389 USDT area would indicate that the previous rebound failed to hold and that bearish pressure is once again dominating.
---
⚖️ Conclusion
📊 ASTR/USDT is currently at an important stage within the Descending Trendline structure.
🔻 Bearish: As long as the price remains below the Descending Trendline, the bearish structure has not been fully invalidated.
🟢 Bullish: A breakout and confirmation above the Descending Trendline could open the way toward 0.007050 → 0.009500 → 0.011500 → 0.013950 USDT.
👀 The most important levels to watch:
0.007050 USDT + Descending Trendline
🚨 Do not consider a breakout valid based on a single wick alone. Candle confirmation and the price's ability to hold the breakout area will be important factors in determining whether the breakout is genuine or merely a false breakout.
#ASTR #ASTRUSDT #Crypto

✅ Get Free Signals! Join Our Telegram Channel Here: t.me/TheCryptoNuclear
✅ Twitter: twitter.com/crypto_nuclear
✅ Join Bybit : partner.bybit.com/b/nuclearvip
✅ Benefits : Lifetime Trading Fee Discount -50%
✅ Twitter: twitter.com/crypto_nuclear
✅ Join Bybit : partner.bybit.com/b/nuclearvip
✅ Benefits : Lifetime Trading Fee Discount -50%
Penafian
Maklumat dan penerbitan adalah tidak bertujuan, dan tidak membentuk, nasihat atau cadangan kewangan, pelaburan, dagangan atau jenis lain yang diberikan atau disahkan oleh TradingView. Baca lebih dalam Terma Penggunaan.
✅ Get Free Signals! Join Our Telegram Channel Here: t.me/TheCryptoNuclear
✅ Twitter: twitter.com/crypto_nuclear
✅ Join Bybit : partner.bybit.com/b/nuclearvip
✅ Benefits : Lifetime Trading Fee Discount -50%
✅ Twitter: twitter.com/crypto_nuclear
✅ Join Bybit : partner.bybit.com/b/nuclearvip
✅ Benefits : Lifetime Trading Fee Discount -50%
Penafian
Maklumat dan penerbitan adalah tidak bertujuan, dan tidak membentuk, nasihat atau cadangan kewangan, pelaburan, dagangan atau jenis lain yang diberikan atau disahkan oleh TradingView. Baca lebih dalam Terma Penggunaan.