
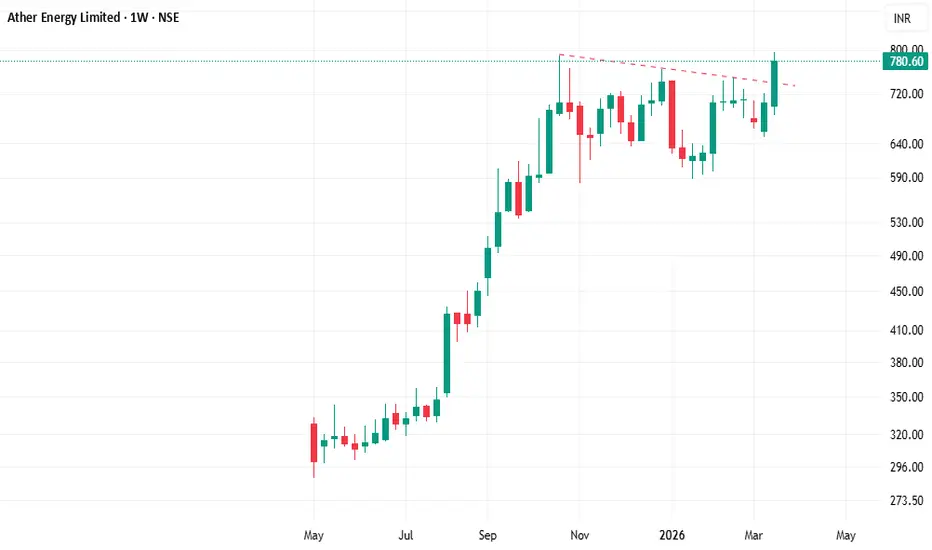
1️⃣ Overall Trend Structure
The weekly chart reflects a strong bullish expansion phase followed by a period of consolidation near higher price levels. After a sharp upward rally, price action has slowed and transitioned into a sideways movement, which is commonly observed when markets absorb earlier gains. The broader structure still shows strength as price continues to hold above prior breakout zones.
The trend currently appears to be in a pause or base-building phase, rather than showing signs of structural weakness.
2️⃣ Chart Pattern Formation
The price action is developing an Ascending Triangle / Ascending Consolidation pattern:
• Higher lows indicate consistent buying interest at progressively higher levels.
• A relatively flat upper boundary shows supply concentration where sellers repeatedly emerge.
• Price compression between these levels suggests accumulation and equilibrium between buyers and sellers.
This pattern typically represents consolidation after momentum expansion.
3️⃣ Support & Resistance Analysis
✅ Support Zones
• ₹700 – ₹720:
Immediate support formed by recent consolidation candles and repeated demand reactions. Buyers have shown willingness to enter near this region.
• ₹590 – ₹610:
Strong structural support aligned with the earlier breakout area and prior resistance turned support.
⛔ Resistance Zones
• ₹780 – ₹800:
Immediate resistance where price is currently facing supply pressure and multiple rejections.
• ₹820 – ₹840:
Higher resistance area near previous swing highs, representing a strong supply zone on the weekly timeframe.
4️⃣ Price Behaviour & Market Psychology
• The sharp rally indicates strong institutional participation during the earlier phase.
• Current consolidation reflects profit booking combined with fresh accumulation.
• Candlestick structure shows reduced volatility compared to the rally phase, suggesting balance between demand and supply.
• Holding near highs instead of deep correction indicates underlying strength in market sentiment.
5️⃣ Momentum & Structure Observation
• Momentum has cooled after the vertical rise, which is technically healthy.
• Price is respecting rising support, maintaining a constructive structure.
• Compression of price range signals a decision phase where market participants are positioning around key levels.
6️⃣ Technical Summary
• Primary trend: Uptrend transitioning into consolidation
• Pattern: Ascending Triangle / Range consolidation
• Market phase: Accumulation near highs
• Key focus area: Interaction between rising support and horizontal resistance
Disclaimer
This analysis is provided solely for educational and informational purposes based on technical chart structure and price action. It should not be considered financial, trading, or investment advice.
Dagangan ditutup secara manual
720-850 done..... Nota
720 > 850 > 940Nota
supply is emerging at higher levels.... Nota
+++ All Time High 
Penafian
Maklumat dan penerbitan adalah tidak bertujuan, dan tidak membentuk, nasihat atau cadangan kewangan, pelaburan, dagangan atau jenis lain yang diberikan atau disahkan oleh TradingView. Baca lebih dalam Terma Penggunaan.
Penafian
Maklumat dan penerbitan adalah tidak bertujuan, dan tidak membentuk, nasihat atau cadangan kewangan, pelaburan, dagangan atau jenis lain yang diberikan atau disahkan oleh TradingView. Baca lebih dalam Terma Penggunaan.