
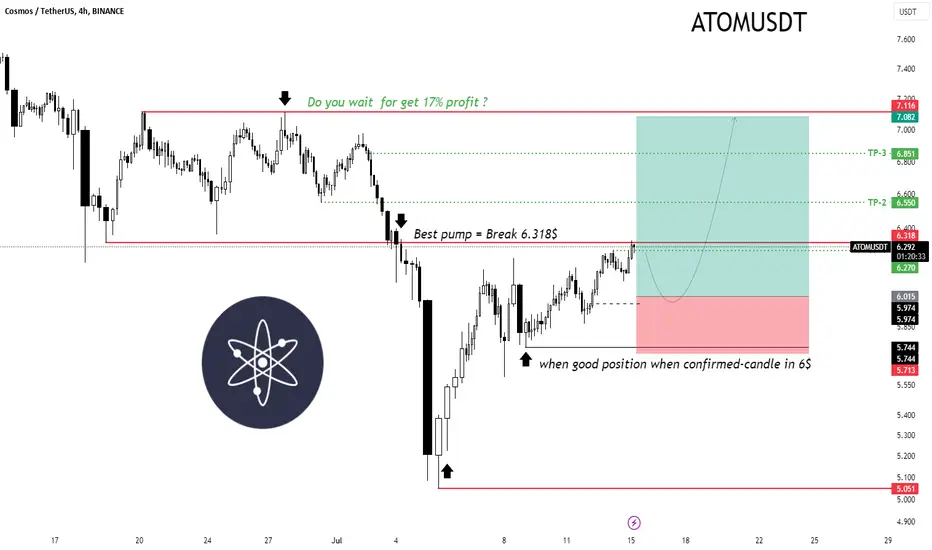
ATOMUSDT Analysis 📊
Key Levels:
Resistance Level: $7.116 🔴
Support Level: $5.051 🟢
Entry Level: Around $6.270 to $6.318 🚀
Take Profit Points (TP):
TP-1: $6.550 🥇
TP-2: $6.851 🥈
TP-3: $7.082 🥉
Trend Analysis:
Bullish Movement (Pump):
The chart indicates the best entry point after breaking the resistance at $6.318 🚀.
In this case, there is a strong probability of a bullish move that could push the price to the specified targets 📈.
Entry and Exit Points:
Entry: When the confirmed candle is around $6. 📥
Exit: At target levels $6.550, $6.851, and $7.082 depending on risk tolerance and profit goals 📤.
Risk Management:
Stop Loss: Around $5.744 to $5.713 ❌.
Profit Target: Up to 17% 📈.
Recommendations:
Profit Expectation: If you aim for a 17% profit, wait for the price to reach $7.116 🤑.
Entry Condition: It’s best to enter after confirming the resistance break and closing the candle above $6.318 ✅.
Position Management: Always consider your risk-to-reward ratio and stick to confirmed signals 🔍.
This analysis is based on the provided information and chart. Always conduct your analysis and review your strategies 📚. Also, never forget risk management 🛡️.
Key Levels:
Resistance Level: $7.116 🔴
Support Level: $5.051 🟢
Entry Level: Around $6.270 to $6.318 🚀
Take Profit Points (TP):
TP-1: $6.550 🥇
TP-2: $6.851 🥈
TP-3: $7.082 🥉
Trend Analysis:
Bullish Movement (Pump):
The chart indicates the best entry point after breaking the resistance at $6.318 🚀.
In this case, there is a strong probability of a bullish move that could push the price to the specified targets 📈.
Entry and Exit Points:
Entry: When the confirmed candle is around $6. 📥
Exit: At target levels $6.550, $6.851, and $7.082 depending on risk tolerance and profit goals 📤.
Risk Management:
Stop Loss: Around $5.744 to $5.713 ❌.
Profit Target: Up to 17% 📈.
Recommendations:
Profit Expectation: If you aim for a 17% profit, wait for the price to reach $7.116 🤑.
Entry Condition: It’s best to enter after confirming the resistance break and closing the candle above $6.318 ✅.
Position Management: Always consider your risk-to-reward ratio and stick to confirmed signals 🔍.
This analysis is based on the provided information and chart. Always conduct your analysis and review your strategies 📚. Also, never forget risk management 🛡️.
Dagangan aktif
Im not stop loss -- confirmed candle for buy this⬇️⬇️⬇️Nota
TP=1 🟢
Penerbitan berkaitan
Penafian
Maklumat dan penerbitan adalah tidak bertujuan, dan tidak membentuk, nasihat atau cadangan kewangan, pelaburan, dagangan atau jenis lain yang diberikan atau disahkan oleh TradingView. Baca lebih dalam Terma Penggunaan.
Penerbitan berkaitan
Penafian
Maklumat dan penerbitan adalah tidak bertujuan, dan tidak membentuk, nasihat atau cadangan kewangan, pelaburan, dagangan atau jenis lain yang diberikan atau disahkan oleh TradingView. Baca lebih dalam Terma Penggunaan.