
🏢 Company & Catalyst
Snapshot: Aritzia is a vertically integrated "Everyday Luxury" fashion house, currently aggressively expanding its U.S. footprint (driving ~50%+ of revenue) while maintaining high-margin e-commerce operations.
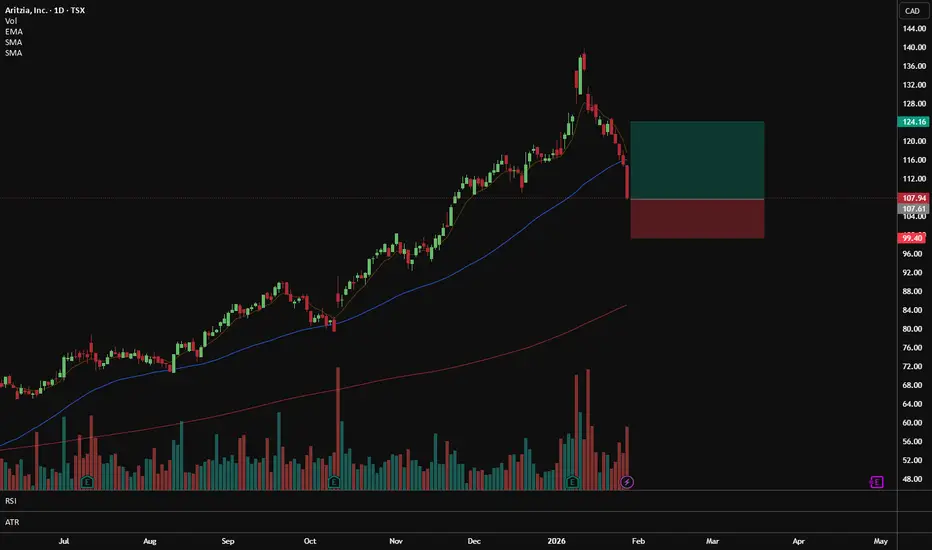
Why Now: Following a parabolic run-up throughout Fiscal 2026, the stock has triggered a high-volume liquidation event, dropping over 6% in a single session. This "flush" has pushed price into a statistical extreme, activating our proprietary mean reversion signal.
📊 Fundamental & Sector Fit
Valuation/Health: Aritzia trades at a premium valuation (P/E ~38x) compared to the broader TSX Consumer Discretionary sector (avg ~21x), reflecting its status as a high-beta growth vehicle rather than a value play.
Sector Velocity: The Consumer Discretionary sector has been volatile; ATZ is currently acting as a "high beta" lag, flushing harder than the index. This divergence often signals a temporary capitulation rather than a structural break.
Thesis Tie-in: The underlying business remains robust with double-digit revenue growth driven by U.S. expansion. This technical drop represents a valuation reset (shaking out weak hands) within a primary uptrend, not a fundamental deterioration.
📐 Technical Structure (The "Why")
Primary Setup: Mean Reversion / Oversold Bounce. The stock has printed a wide-range bearish candle that extended significantly below the 20-day EMA (orange) and pierced the lower bounds of the volatility bands.
Trend Context: The primary trend remains bullish. Price is correcting but holds well above the rising 200-day SMA (grey line), which acts as the ultimate "line in the sand" for the long-term trend.
Key Indicator Signal: The "Kev Reversion v2.0" indicator has fired a visible LONG tag. This algorithm typically identifies exhaustion points where selling pressure is statistically likely to snap back.
Volume Profile: The setup candle shows a massive volume spike (963K+ shares), confirming "capitulation" behavior—often the precursor to a V-shaped recovery.
Key Levels:
Support: 104.00 – 107.00 (Immediate structural support & psychological zone).
Resistance: 116.00 (Breakdown level / 20EMA) – 124.16 (Gap fill target).
🎯 Execution Plan
Entry Zone: $107.50 – $108.00 (Market entry on the open or limit order at the previous close to capture the immediate snap-back).
Stop Loss: $99.40 (Hard stop placed below the psychological $100 level and the recent swing low structure).
Take Profit: $124.16 (Targeting the liquidity void/gap created by the flush).
Risk/Reward: 1.96R (Risking ~$8.50 to make ~$16.20). Note: Active management required at 116.00 to lock in partial profits.
🧠 Analyst's Bias
The "weak hands" who chased the breakout have been stopped out on this -6% flush. We are taking the contrarian side, buying fear into a primary uptrend. The "LONG" signal combined with the rising 200SMA suggests this is a classic "buy the dip" opportunity before the trend resumes.
Snapshot: Aritzia is a vertically integrated "Everyday Luxury" fashion house, currently aggressively expanding its U.S. footprint (driving ~50%+ of revenue) while maintaining high-margin e-commerce operations.
Why Now: Following a parabolic run-up throughout Fiscal 2026, the stock has triggered a high-volume liquidation event, dropping over 6% in a single session. This "flush" has pushed price into a statistical extreme, activating our proprietary mean reversion signal.
📊 Fundamental & Sector Fit
Valuation/Health: Aritzia trades at a premium valuation (P/E ~38x) compared to the broader TSX Consumer Discretionary sector (avg ~21x), reflecting its status as a high-beta growth vehicle rather than a value play.
Sector Velocity: The Consumer Discretionary sector has been volatile; ATZ is currently acting as a "high beta" lag, flushing harder than the index. This divergence often signals a temporary capitulation rather than a structural break.
Thesis Tie-in: The underlying business remains robust with double-digit revenue growth driven by U.S. expansion. This technical drop represents a valuation reset (shaking out weak hands) within a primary uptrend, not a fundamental deterioration.
📐 Technical Structure (The "Why")
Primary Setup: Mean Reversion / Oversold Bounce. The stock has printed a wide-range bearish candle that extended significantly below the 20-day EMA (orange) and pierced the lower bounds of the volatility bands.
Trend Context: The primary trend remains bullish. Price is correcting but holds well above the rising 200-day SMA (grey line), which acts as the ultimate "line in the sand" for the long-term trend.
Key Indicator Signal: The "Kev Reversion v2.0" indicator has fired a visible LONG tag. This algorithm typically identifies exhaustion points where selling pressure is statistically likely to snap back.
Volume Profile: The setup candle shows a massive volume spike (963K+ shares), confirming "capitulation" behavior—often the precursor to a V-shaped recovery.
Key Levels:
Support: 104.00 – 107.00 (Immediate structural support & psychological zone).
Resistance: 116.00 (Breakdown level / 20EMA) – 124.16 (Gap fill target).
🎯 Execution Plan
Entry Zone: $107.50 – $108.00 (Market entry on the open or limit order at the previous close to capture the immediate snap-back).
Stop Loss: $99.40 (Hard stop placed below the psychological $100 level and the recent swing low structure).
Take Profit: $124.16 (Targeting the liquidity void/gap created by the flush).
Risk/Reward: 1.96R (Risking ~$8.50 to make ~$16.20). Note: Active management required at 116.00 to lock in partial profits.
🧠 Analyst's Bias
The "weak hands" who chased the breakout have been stopped out on this -6% flush. We are taking the contrarian side, buying fear into a primary uptrend. The "LONG" signal combined with the rising 200SMA suggests this is a classic "buy the dip" opportunity before the trend resumes.

ClearPoint Trading 🎯
Indicators • Education • Execution
whop.com/clearpointtrading | discord.gg/8sEwMnpz
Indicators • Education • Execution
whop.com/clearpointtrading | discord.gg/8sEwMnpz
Penafian
Maklumat dan penerbitan adalah tidak bertujuan, dan tidak membentuk, nasihat atau cadangan kewangan, pelaburan, dagangan atau jenis lain yang diberikan atau disahkan oleh TradingView. Baca lebih dalam Terma Penggunaan.
ClearPoint Trading 🎯
Indicators • Education • Execution
whop.com/clearpointtrading | discord.gg/8sEwMnpz
Indicators • Education • Execution
whop.com/clearpointtrading | discord.gg/8sEwMnpz
Penafian
Maklumat dan penerbitan adalah tidak bertujuan, dan tidak membentuk, nasihat atau cadangan kewangan, pelaburan, dagangan atau jenis lain yang diberikan atau disahkan oleh TradingView. Baca lebih dalam Terma Penggunaan.