
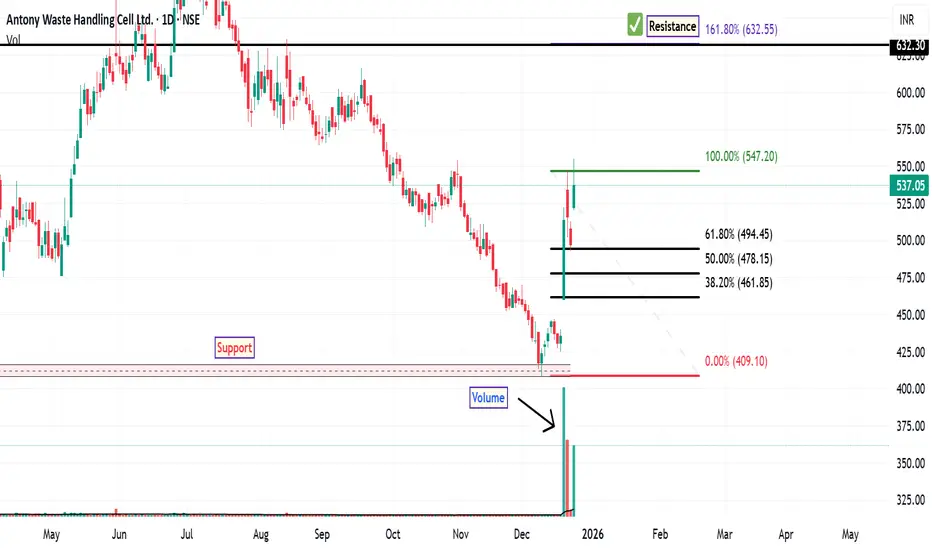
The stock of AWHCL has shown signs of recovery after a prolonged downtrend that began in September. Recent price action suggests a potential shift in momentum, supported by multiple technical factors across daily and weekly timeframes.
The stock has bounced from a long-term support level marked on the chart. The recent retracement from the swing high and higher low aligns with the 61.8% Fibonacci level, a zone often considered significant for trend continuation, indicating strong bullish momentum.
A bullish MACD crossover occurred on the daily chart last week, and notably, a weekly MACD crossover has been confirmed today. This dual timeframe alignment strengthens the bullish outlook.
The RSI readings support the bullish scenario, reflecting improving momentum without entering extreme overbought territory.
On the daily chart, the stock has managed to close above the 200DEMA, a key indicator of long-term trend strength which also seen by volume growth.
Key Levels to Monitor:
Support Zone: Around ₹417 (critical level for trend validation)
Resistance Zone: Near ₹632, which coincides with the 1.618 Fibonacci extension level, often viewed as a potential target in bullish setups.
Disclaimer: This analysis is intended for educational and informational purposes only. It does not constitute investment advice or a recommendation to buy, sell, or hold any financial instrument. Market participants should conduct independent research and consult a licensed financial advisor before making any investment decisions.
The stock has bounced from a long-term support level marked on the chart. The recent retracement from the swing high and higher low aligns with the 61.8% Fibonacci level, a zone often considered significant for trend continuation, indicating strong bullish momentum.
A bullish MACD crossover occurred on the daily chart last week, and notably, a weekly MACD crossover has been confirmed today. This dual timeframe alignment strengthens the bullish outlook.
The RSI readings support the bullish scenario, reflecting improving momentum without entering extreme overbought territory.
On the daily chart, the stock has managed to close above the 200DEMA, a key indicator of long-term trend strength which also seen by volume growth.
Key Levels to Monitor:
Support Zone: Around ₹417 (critical level for trend validation)
Resistance Zone: Near ₹632, which coincides with the 1.618 Fibonacci extension level, often viewed as a potential target in bullish setups.
Disclaimer: This analysis is intended for educational and informational purposes only. It does not constitute investment advice or a recommendation to buy, sell, or hold any financial instrument. Market participants should conduct independent research and consult a licensed financial advisor before making any investment decisions.

Penafian
Maklumat dan penerbitan adalah tidak bertujuan, dan tidak membentuk, nasihat atau cadangan kewangan, pelaburan, dagangan atau jenis lain yang diberikan atau disahkan oleh TradingView. Baca lebih dalam Terma Penggunaan.
Penafian
Maklumat dan penerbitan adalah tidak bertujuan, dan tidak membentuk, nasihat atau cadangan kewangan, pelaburan, dagangan atau jenis lain yang diberikan atau disahkan oleh TradingView. Baca lebih dalam Terma Penggunaan.