The stock is currently in a high-risk area for buying.
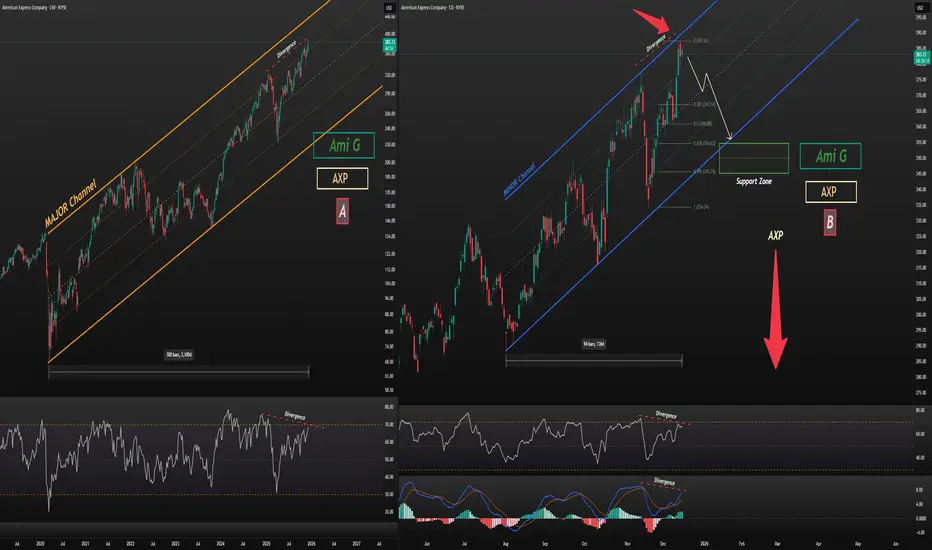
Chart A (Weekly): Price is near the upper boundary of its 5-year channel, accompanied by a clear RSI divergence.
Chart B (Daily): Price is at the top of its 5-month channel, while both MACD and RSI show strong divergences.
Based on these signals, this stock appears to be in a very risky buying zone, with a potential corrective move down to around $355.
This analysis will be updated as the situation develops.
Follow me on TradingView for more analyses and live stock trades.
 AXP
Chart A (Weekly): Price is near the upper boundary of its 5-year channel, accompanied by a clear RSI divergence.
Chart B (Daily): Price is at the top of its 5-month channel, while both MACD and RSI show strong divergences.
Based on these signals, this stock appears to be in a very risky buying zone, with a potential corrective move down to around $355.
This analysis will be updated as the situation develops.
Follow me on TradingView for more analyses and live stock trades.
AXP Dagangan ditutup: sasaran tercapai

AG-Precision-Trading
📈 Live Trading: Stocks & Crypto
🔍 Symbol Analysis & Insights
💎 Understanding Relative Asset Values
📈 Live Trading: Stocks & Crypto
🔍 Symbol Analysis & Insights
💎 Understanding Relative Asset Values
Penafian
Maklumat dan penerbitan adalah tidak bertujuan, dan tidak membentuk, nasihat atau cadangan kewangan, pelaburan, dagangan atau jenis lain yang diberikan atau disahkan oleh TradingView. Baca lebih dalam Terma Penggunaan.
AG-Precision-Trading
📈 Live Trading: Stocks & Crypto
🔍 Symbol Analysis & Insights
💎 Understanding Relative Asset Values
📈 Live Trading: Stocks & Crypto
🔍 Symbol Analysis & Insights
💎 Understanding Relative Asset Values
Penafian
Maklumat dan penerbitan adalah tidak bertujuan, dan tidak membentuk, nasihat atau cadangan kewangan, pelaburan, dagangan atau jenis lain yang diberikan atau disahkan oleh TradingView. Baca lebih dalam Terma Penggunaan.