
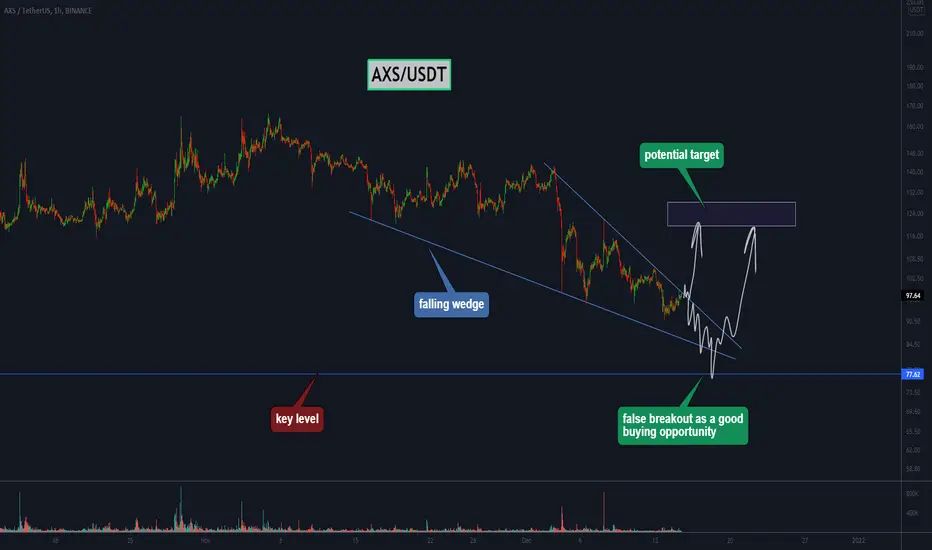
A falling wedge pattern has formed on the AXS chart, it is a bullish structure, it is statistically breaking up, but bitcoin could once again renew its local lows, so two scenarios are worth highlighting.
The first scenario is that the price breaks through the upper boundary of the wedge, after which there could be a rise to the targets marked at the top.
The second scenario is that the price falls and breaks the pattern downwards, in case of a false breakdown of the 77$ level there would be a good buying opportunity.
Write in the comments all your questions and instruments analysis of which you want to see.
Friends, push the like button, write a comment, and share with your mates - that would be the best THANK YOU.
P.S. I personally will open entry if the price will show it according to my strategy.
Always make your analysis before a trade.

Join our copy service -
FREE trial
👇👇
bikotrading.short.gy/biko_copi
TG channel, Join to get all important updates and special BONUS $500 on your trading account
👇👇
t.me/+ICrmLIneDmRiYjIy
FREE trial
👇👇
bikotrading.short.gy/biko_copi
TG channel, Join to get all important updates and special BONUS $500 on your trading account
👇👇
t.me/+ICrmLIneDmRiYjIy
Penerbitan berkaitan
Penafian
Maklumat dan penerbitan adalah tidak bertujuan, dan tidak membentuk, nasihat atau cadangan kewangan, pelaburan, dagangan atau jenis lain yang diberikan atau disahkan oleh TradingView. Baca lebih dalam Terma Penggunaan.