
Dear Followers,
Hi Folks. I am posting a Chart after a long time due to the regulatory issues in my country.
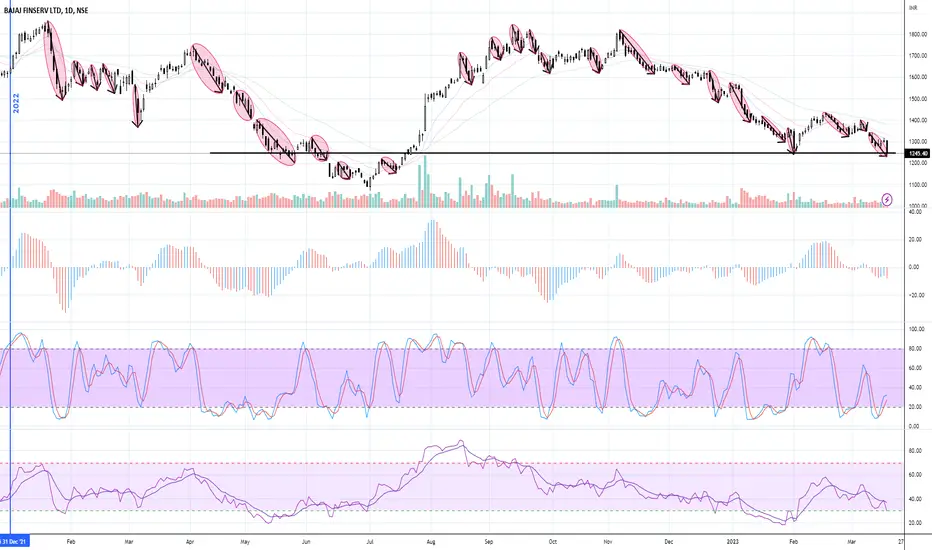
I have done the analysis on Bajaj Finserv Ltd - Daily Chart from 01.01.2022 - 20.03.2023
The stock has been in a continuous downtrend since past few months.
The daily chart have a Double Bottom @ 1246 levels which is considered a STRONG SUPPORT ZONE.
The Prices are below EMA. Let the prices go above 1339 to enter a long position
There is a Bullish Divergence in RSI which needs a tick up for further upside movement.
The stock will create a very good upside movement once it goes above 1339 levels
Watch out for the price action.
DISCLAIMER: Please be advised that this Chart is for educational purposes only and shall not be consideration as a Buy / Sell Recommendation.
Hi Folks. I am posting a Chart after a long time due to the regulatory issues in my country.
I have done the analysis on Bajaj Finserv Ltd - Daily Chart from 01.01.2022 - 20.03.2023
The stock has been in a continuous downtrend since past few months.
The daily chart have a Double Bottom @ 1246 levels which is considered a STRONG SUPPORT ZONE.
The Prices are below EMA. Let the prices go above 1339 to enter a long position
There is a Bullish Divergence in RSI which needs a tick up for further upside movement.
The stock will create a very good upside movement once it goes above 1339 levels
Watch out for the price action.
DISCLAIMER: Please be advised that this Chart is for educational purposes only and shall not be consideration as a Buy / Sell Recommendation.

Team Prashant Bhiwaniwala
Penafian
Maklumat dan penerbitan adalah tidak bertujuan, dan tidak membentuk, nasihat atau cadangan kewangan, pelaburan, dagangan atau jenis lain yang diberikan atau disahkan oleh TradingView. Baca lebih dalam Terma Penggunaan.
Team Prashant Bhiwaniwala
Penafian
Maklumat dan penerbitan adalah tidak bertujuan, dan tidak membentuk, nasihat atau cadangan kewangan, pelaburan, dagangan atau jenis lain yang diberikan atau disahkan oleh TradingView. Baca lebih dalam Terma Penggunaan.