
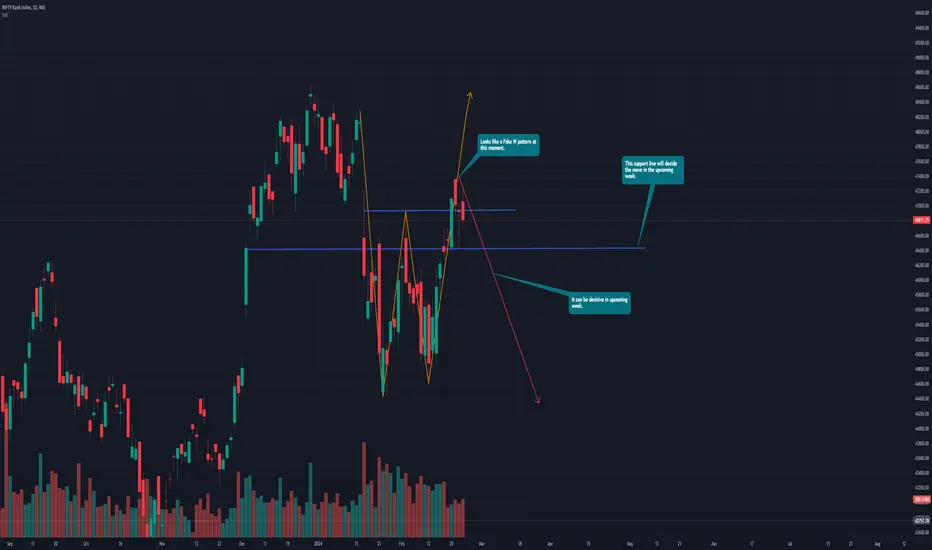
Hourly chart shows M pattern breakout. Initially i though it is head and shoulder but instead it formed M pattern and trend indicates downward movement. (posted in my previous post).
Right now, on Daily chart it looks it didn't proceed with W pattern. BankNifty has trapped CE buyers who would have thought that it'll fill the gap upper side. Some downnside movement in past 3 days but it was a good fight. Bulls are not exhausted yet.
Right now, on Daily chart it looks it didn't proceed with W pattern. BankNifty has trapped CE buyers who would have thought that it'll fill the gap upper side. Some downnside movement in past 3 days but it was a good fight. Bulls are not exhausted yet.

Thanks.
TradeTech Analysis
Telegram Channel - t.me/Tradetech2024
Youtube Channel - youtube.com/@TradeTechAnalysis
Website - tradetechanalysis.com/
Super Profile - superprofile.bio/tradetechanalysis
TradeTech Analysis
Telegram Channel - t.me/Tradetech2024
Youtube Channel - youtube.com/@TradeTechAnalysis
Website - tradetechanalysis.com/
Super Profile - superprofile.bio/tradetechanalysis
Penerbitan berkaitan
Penafian
Maklumat dan penerbitan adalah tidak bertujuan, dan tidak membentuk, nasihat atau cadangan kewangan, pelaburan, dagangan atau jenis lain yang diberikan atau disahkan oleh TradingView. Baca lebih dalam Terma Penggunaan.