
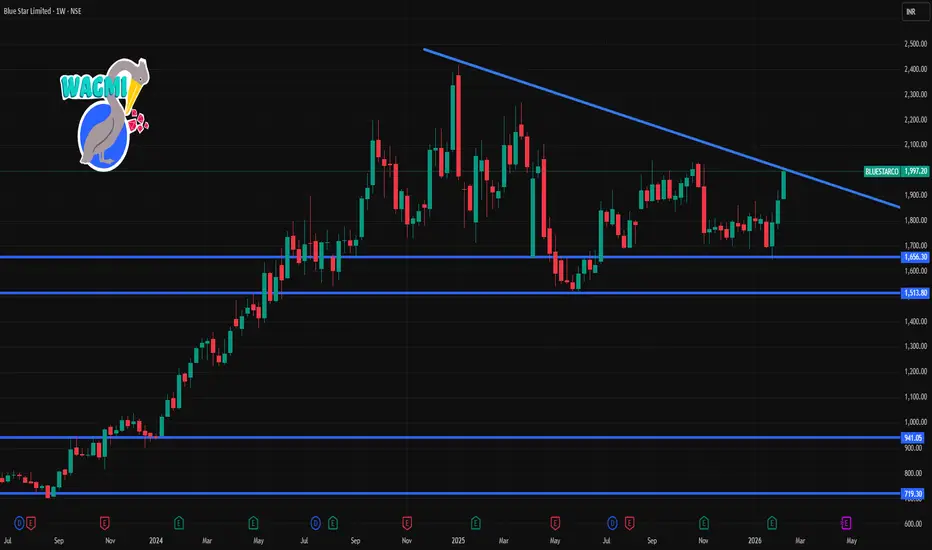
📈 Weekly Support & Resistance Levels (Approximate)
These are levels traders watch for price reactions over a 1-week horizon (weekly pivot/swing areas):
Major Resistance Zones (Upside)
• ~₹1,950 – ₹1,990 — key upper range resistance where price faces sellers if trend weakens
• ~₹2,000+ — psychological resistance above short-term range (R2/R3 in some pivot models)
Pivot / Intermediate Level
• ~₹1,920 – ₹1,930 — near pivot and recent trading midpoint zone
Support Zones (Downside)
• ~₹1,940 – ₹1,922 — short-term support region (recent pivot S1/S2)
• ~₹1,900 – ₹1,890 — next support if market weakens
• ~₹1,850 – ₹1,820 — broader support below the week’s consolidation low
These levels are typically derived from pivot calculations, recent swing highs/lows, and moving average clusters on weekly charts.
📊 Weekly Chart Context
✔ The stock has shown moderate upside momentum over past weeks (one-week gains reported in some data)
✔ On a weekly timeframe, closing above ~₹1,950 – ₹1,990 could signal continuation toward higher resistance zones.
✔ Weekly support near ~₹1,900 / ₹1,880 acts as a key pivot for bull/bear decision.
📌 Interpretation (Weekly)
🔹 Bullish scenario: Sustained closes above resistance pivots (₹1,950+) with volume can push toward ₹2,000+ levels.
🔹 Neutral / consolidation: Price bouncing between ₹1,900 and ₹1,950 indicates sideways action.
🔹 Bearish scenario: Break below ₹1,880-₹1,870 opens broader downside toward short-term support around ₹1,820 area.
These are levels traders watch for price reactions over a 1-week horizon (weekly pivot/swing areas):
Major Resistance Zones (Upside)
• ~₹1,950 – ₹1,990 — key upper range resistance where price faces sellers if trend weakens
• ~₹2,000+ — psychological resistance above short-term range (R2/R3 in some pivot models)
Pivot / Intermediate Level
• ~₹1,920 – ₹1,930 — near pivot and recent trading midpoint zone
Support Zones (Downside)
• ~₹1,940 – ₹1,922 — short-term support region (recent pivot S1/S2)
• ~₹1,900 – ₹1,890 — next support if market weakens
• ~₹1,850 – ₹1,820 — broader support below the week’s consolidation low
These levels are typically derived from pivot calculations, recent swing highs/lows, and moving average clusters on weekly charts.
📊 Weekly Chart Context
✔ The stock has shown moderate upside momentum over past weeks (one-week gains reported in some data)
✔ On a weekly timeframe, closing above ~₹1,950 – ₹1,990 could signal continuation toward higher resistance zones.
✔ Weekly support near ~₹1,900 / ₹1,880 acts as a key pivot for bull/bear decision.
📌 Interpretation (Weekly)
🔹 Bullish scenario: Sustained closes above resistance pivots (₹1,950+) with volume can push toward ₹2,000+ levels.
🔹 Neutral / consolidation: Price bouncing between ₹1,900 and ₹1,950 indicates sideways action.
🔹 Bearish scenario: Break below ₹1,880-₹1,870 opens broader downside toward short-term support around ₹1,820 area.

Contact Knowledgehub for a detailed consultation: Dm on WhatsApp: [wa.link/a2o0kz]-
Phone No: [+91 93102 26243]-
Email: [tradingviewknowledgehub@gmail.com]---
-- Let’s achieve success together!
Phone No: [+91 93102 26243]-
Email: [tradingviewknowledgehub@gmail.com]---
-- Let’s achieve success together!
Penerbitan berkaitan
Penafian
Maklumat dan penerbitan adalah tidak bertujuan, dan tidak membentuk, nasihat atau cadangan kewangan, pelaburan, dagangan atau jenis lain yang diberikan atau disahkan oleh TradingView. Baca lebih dalam Terma Penggunaan.
Contact Knowledgehub for a detailed consultation: Dm on WhatsApp: [wa.link/a2o0kz]-
Phone No: [+91 93102 26243]-
Email: [tradingviewknowledgehub@gmail.com]---
-- Let’s achieve success together!
Phone No: [+91 93102 26243]-
Email: [tradingviewknowledgehub@gmail.com]---
-- Let’s achieve success together!
Penerbitan berkaitan
Penafian
Maklumat dan penerbitan adalah tidak bertujuan, dan tidak membentuk, nasihat atau cadangan kewangan, pelaburan, dagangan atau jenis lain yang diberikan atau disahkan oleh TradingView. Baca lebih dalam Terma Penggunaan.