
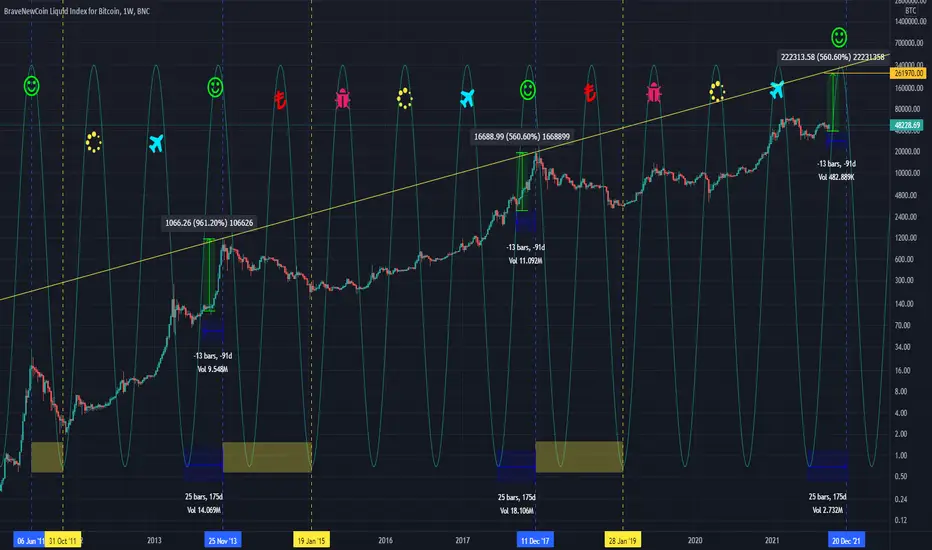
A sine wave is a geometric waveform that oscillates periodically, and is defined by the function y = sin x.
The sine wave indicator is based on the assumption that markets move in cyclical patterns. After quantifying a cycle, a trader may try to use the pattern to develop a leading indicator. This works extremely well when the market is indeed moving in a cycle.
The sine wave as a technical chart analysis tool is based on advanced mathematics and is designed to indicate whether a market is trending or in a cycle mode. It helps traders identify the start and finish of a trending move as well as possible shifts in the trend.
The sine wave indicator is based on the assumption that markets move in cyclical patterns. After quantifying a cycle, a trader may try to use the pattern to develop a leading indicator. This works extremely well when the market is indeed moving in a cycle.
The sine wave as a technical chart analysis tool is based on advanced mathematics and is designed to indicate whether a market is trending or in a cycle mode. It helps traders identify the start and finish of a trending move as well as possible shifts in the trend.

Penerbitan berkaitan
Penafian
Maklumat dan penerbitan adalah tidak bertujuan, dan tidak membentuk, nasihat atau cadangan kewangan, pelaburan, dagangan atau jenis lain yang diberikan atau disahkan oleh TradingView. Baca lebih dalam Terma Penggunaan.
Penerbitan berkaitan
Penafian
Maklumat dan penerbitan adalah tidak bertujuan, dan tidak membentuk, nasihat atau cadangan kewangan, pelaburan, dagangan atau jenis lain yang diberikan atau disahkan oleh TradingView. Baca lebih dalam Terma Penggunaan.