
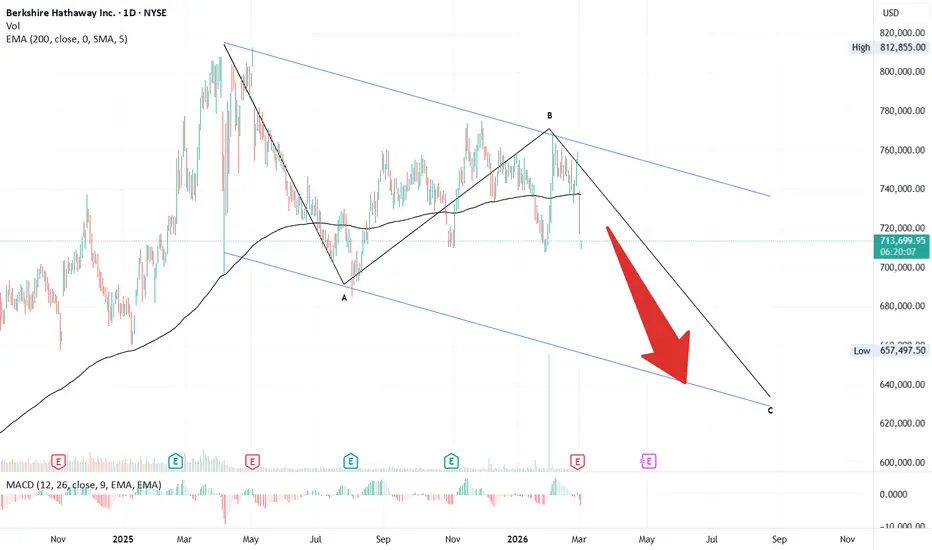
📊 Berkshire Hathaway: Elliott Wave View
🕰️ Context
Since May 2025, Berkshire Hathaway entered a correction. The drop to 682k completed Wave A in five sub-waves — classic Zigzag setup.
🔎 Structure
• 📉 Wave A: Low at 682k
• 🔄 Wave B: Retraced near 61.8% Fibonacci
• 📉 Wave C: Projection toward 640k → ~15% downside
📊 Implications
• 📐 Zigzag retracements often hit 50–61.8%
• ⚠️ Risk: A move to 640k is significant
• 🔀 Alternatives:• ✅ Hold above 682k → correction may end
• ❌ Break below 640k → complex correction likely
🧭 Conclusion
Berkshire’s correction looks unfinished, with 640k as a key target. Watch 682k and 640k for signals of completion or deeper structure.

Penerbitan berkaitan
Penafian
Maklumat dan penerbitan adalah tidak bertujuan, dan tidak membentuk, nasihat atau cadangan kewangan, pelaburan, dagangan atau jenis lain yang diberikan atau disahkan oleh TradingView. Baca lebih dalam Terma Penggunaan.
Penerbitan berkaitan
Penafian
Maklumat dan penerbitan adalah tidak bertujuan, dan tidak membentuk, nasihat atau cadangan kewangan, pelaburan, dagangan atau jenis lain yang diberikan atau disahkan oleh TradingView. Baca lebih dalam Terma Penggunaan.