
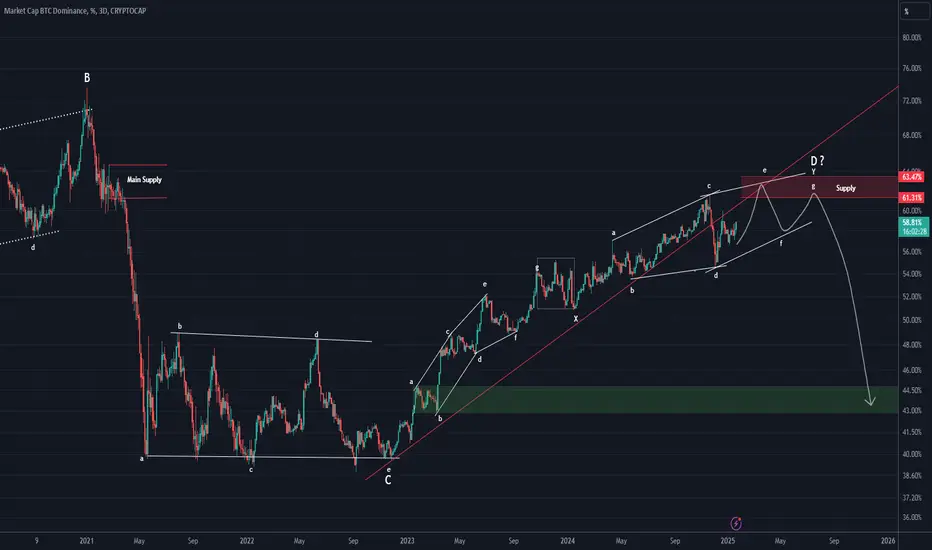
First of all, pay attention to the timeframe; it’s a daily timeframe, and this analysis is time-consuming.
The subwaves of this index are numerous, even in higher timeframes, which results in multiple technical analysis scenarios. However, we always identify the most probable scenario.
Given the lack of a drop in Bitcoin dominance over the past weeks, despite losing the trendline, it can be inferred that the wave structure of this index is likely not yet complete.
From the bottom, we believe there is a double combination pattern, with both combinations appearing to be diametrics.
It seems that the primary peak of Bitcoin dominance will be within this red zone.
The waves have been marked on the chart.
Overall, it appears that this index intends to hunt a specific area before dropping. Let’s see what happens.
For risk management, please don't forget stop loss and capital management
Comment if you have any questions
Thank You
The subwaves of this index are numerous, even in higher timeframes, which results in multiple technical analysis scenarios. However, we always identify the most probable scenario.
Given the lack of a drop in Bitcoin dominance over the past weeks, despite losing the trendline, it can be inferred that the wave structure of this index is likely not yet complete.
From the bottom, we believe there is a double combination pattern, with both combinations appearing to be diametrics.
It seems that the primary peak of Bitcoin dominance will be within this red zone.
The waves have been marked on the chart.
Overall, it appears that this index intends to hunt a specific area before dropping. Let’s see what happens.
For risk management, please don't forget stop loss and capital management
Comment if you have any questions
Thank You
Dagangan aktif
It is still valid. We anticipate a very strong rejection for Bitcoin dominance from the yellow circle.The darkest moment of the night is the closest moment to sunrise
Dagangan ditutup: sasaran tercapai
In the initial analysis, we examined Bitcoin dominance from the 58.79 level and identified the 63 level. It pumped over 9% and reached this level.In our view, the 63-65 level will not be broken.
The bullish trend in altcoins, in addition to this index, also depends on USDT dominance.

🔥 Don't Just Watch the Market. Understand It!
📊 Crypto Analysis & Setups:
👉 t.me/Behdark_EN
💹 Forex Analysis & Setups:
👉 t.me/FX_Behdark
🚀 Join BehDark for Market Insights, Trading Setups & Key Levels. Choose Your Market & Join Us!
📊 Crypto Analysis & Setups:
👉 t.me/Behdark_EN
💹 Forex Analysis & Setups:
👉 t.me/FX_Behdark
🚀 Join BehDark for Market Insights, Trading Setups & Key Levels. Choose Your Market & Join Us!
Penafian
Maklumat dan penerbitan adalah tidak bertujuan, dan tidak membentuk, nasihat atau cadangan kewangan, pelaburan, dagangan atau jenis lain yang diberikan atau disahkan oleh TradingView. Baca lebih dalam Terma Penggunaan.
🔥 Don't Just Watch the Market. Understand It!
📊 Crypto Analysis & Setups:
👉 t.me/Behdark_EN
💹 Forex Analysis & Setups:
👉 t.me/FX_Behdark
🚀 Join BehDark for Market Insights, Trading Setups & Key Levels. Choose Your Market & Join Us!
📊 Crypto Analysis & Setups:
👉 t.me/Behdark_EN
💹 Forex Analysis & Setups:
👉 t.me/FX_Behdark
🚀 Join BehDark for Market Insights, Trading Setups & Key Levels. Choose Your Market & Join Us!
Penafian
Maklumat dan penerbitan adalah tidak bertujuan, dan tidak membentuk, nasihat atau cadangan kewangan, pelaburan, dagangan atau jenis lain yang diberikan atau disahkan oleh TradingView. Baca lebih dalam Terma Penggunaan.