
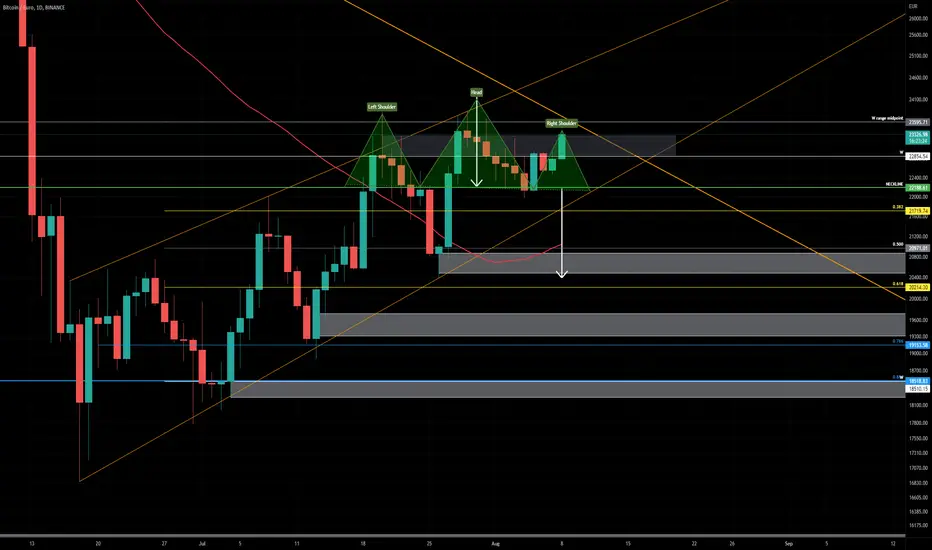
Possible head & shoulder pattern on BTCEUR on the Daily.
Green line = neckline. Measured distance from head to necline is shown and copied to indicate the target to the downside.
Fib-levels (0.382 up to 0.786) are displayed on the chart for possible targets in case of a short.
First target (based on the H&S), around EU20.500 is in between the 0.500 and the 0.618 Fib.
On the 4H there's a bullish orderblock in that same area.
The 50DMA is also around this level.
Lower targets (possible wicks) are around the 0.786Fib (EU19.000 - EU19500) and the 0.886Fib (Eu18.000 - 18.500)

Green line = neckline. Measured distance from head to necline is shown and copied to indicate the target to the downside.
Fib-levels (0.382 up to 0.786) are displayed on the chart for possible targets in case of a short.
First target (based on the H&S), around EU20.500 is in between the 0.500 and the 0.618 Fib.
On the 4H there's a bullish orderblock in that same area.
The 50DMA is also around this level.
Lower targets (possible wicks) are around the 0.786Fib (EU19.000 - EU19500) and the 0.886Fib (Eu18.000 - 18.500)

Penafian
Maklumat dan penerbitan adalah tidak bertujuan, dan tidak membentuk, nasihat atau cadangan kewangan, pelaburan, dagangan atau jenis lain yang diberikan atau disahkan oleh TradingView. Baca lebih dalam Terma Penggunaan.
Penafian
Maklumat dan penerbitan adalah tidak bertujuan, dan tidak membentuk, nasihat atau cadangan kewangan, pelaburan, dagangan atau jenis lain yang diberikan atau disahkan oleh TradingView. Baca lebih dalam Terma Penggunaan.