
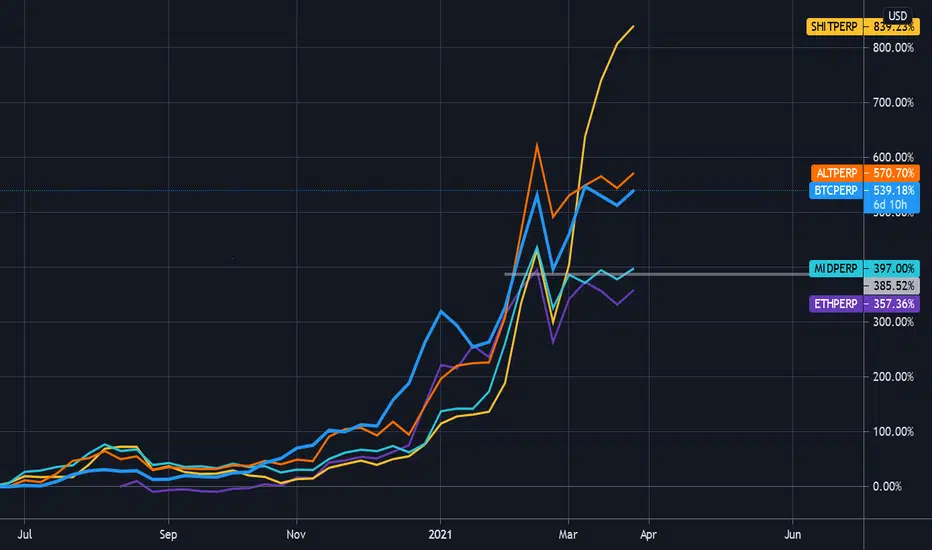
The idea behind this chart is to give a snapshot of the market breadth for the entire crypto market at a glance. It uses the perpetual index futures on the FTX exchange to compare Bitcoin to Ethereum, the ALT index, the Midcap index,and the SHIT index.
This particular chart is using a Weekly interval and uses the March 2020 lows as it's anchor point (adjust scale if necessary). It's clear to see that while Bitcoin has been grabbing most of the headlines, the SHITCOIN index is in the driver's seat (help.ftx.com/hc/en-us/articles/360027668812-Index-Calculation).
This particular chart is using a Weekly interval and uses the March 2020 lows as it's anchor point (adjust scale if necessary). It's clear to see that while Bitcoin has been grabbing most of the headlines, the SHITCOIN index is in the driver's seat (help.ftx.com/hc/en-us/articles/360027668812-Index-Calculation).

Penafian
Maklumat dan penerbitan adalah tidak bertujuan, dan tidak membentuk, nasihat atau cadangan kewangan, pelaburan, dagangan atau jenis lain yang diberikan atau disahkan oleh TradingView. Baca lebih dalam Terma Penggunaan.
Penafian
Maklumat dan penerbitan adalah tidak bertujuan, dan tidak membentuk, nasihat atau cadangan kewangan, pelaburan, dagangan atau jenis lain yang diberikan atau disahkan oleh TradingView. Baca lebih dalam Terma Penggunaan.