
Bitcoin has just received the kind of macro data that should have made a breakout easier.
July U.S. CPI rose 0.1% month over month, exactly in line with expectations, while annual inflation eased to 3.4% from 3.5%. Core inflation also slowed to 2.5% year over year. Treasury yields fell, the dollar softened, and broader risk assets reacted positively.
Bitcoin did not.
That is the part that stands out to me.
Price remains below the 65,000 area after another failed attempt to establish acceptance above it. The macro backdrop became slightly more supportive, but the chart still refused to confirm.
There is a similar contradiction in ETF flows.
U.S. spot Bitcoin ETFs recorded $244.4 million of net inflows on August 5, followed by $137.6 million on August 6 and $101.7 million on August 7. Yet flows then reversed to a $144.6 million outflow on August 10 before recovering to only $7.8 million on August 11.
Institutional demand has improved from earlier in the year, but it is still inconsistent.
What the chart shows
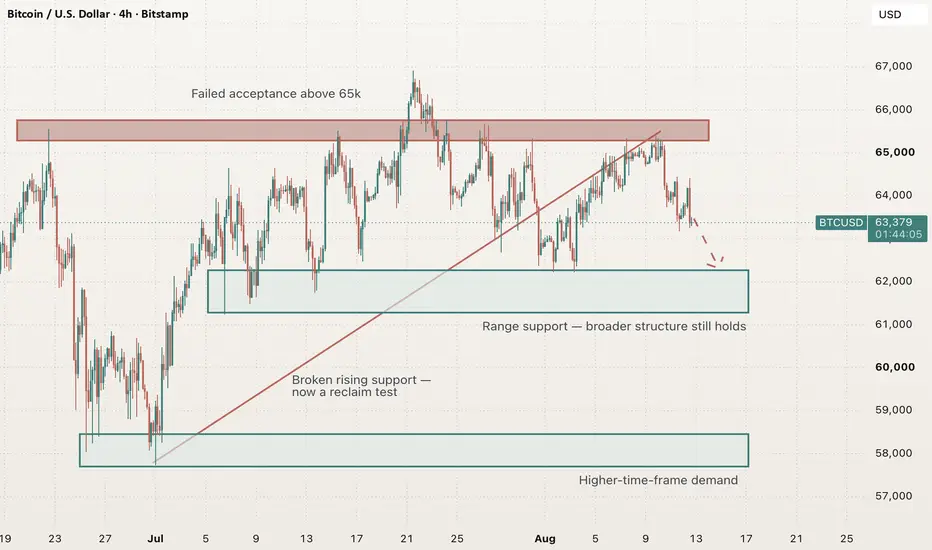
The four-hour chart has lost the rising support line that guided the early-August recovery.
More importantly, price failed repeatedly inside the 64.9–65.6k resistance area before breaking lower.
That gives sellers the short-term advantage.
The broader structure is less decisive. The 61.2–62.2k area remains intact and has already attracted buyers several times. Until that zone fails, the current weakness still sits inside a wider range rather than a confirmed larger breakdown.
Primary interpretation
The cautious view remains stronger while Bitcoin stays below the former rising support and the 65k resistance area.
A move toward 61.2–62.2k would be consistent with the current structure, but the reaction there matters more than reaching the zone itself.
If buyers defend it again, the market may simply be extending the range.
Alternative interpretation
The alternative is a failed breakdown.
That scenario gains credibility if Bitcoin quickly reclaims the broken trendline and then establishes four-hour acceptance above 65k.
The softer inflation backdrop and renewed ETF inflows would make such a recovery more convincing because price would finally begin confirming the external support.
What would change the current view
The bearish reading weakens above 65k.
The broader neutral structure weakens if Bitcoin loses 61.2–62.2k and cannot recover it. In that case, the 57.7–58.5k higher-time-frame demand area becomes more relevant.
What comes next
The next test is whether lower Treasury yields and a softer dollar finally produce follow-through in Bitcoin rather than only in equities and precious metals.
Bitcoin got a friendlier macro backdrop, but buyers still failed the same technical test.
July U.S. CPI rose 0.1% month over month, exactly in line with expectations, while annual inflation eased to 3.4% from 3.5%. Core inflation also slowed to 2.5% year over year. Treasury yields fell, the dollar softened, and broader risk assets reacted positively.
Bitcoin did not.
That is the part that stands out to me.
Price remains below the 65,000 area after another failed attempt to establish acceptance above it. The macro backdrop became slightly more supportive, but the chart still refused to confirm.
There is a similar contradiction in ETF flows.
U.S. spot Bitcoin ETFs recorded $244.4 million of net inflows on August 5, followed by $137.6 million on August 6 and $101.7 million on August 7. Yet flows then reversed to a $144.6 million outflow on August 10 before recovering to only $7.8 million on August 11.
Institutional demand has improved from earlier in the year, but it is still inconsistent.
What the chart shows
The four-hour chart has lost the rising support line that guided the early-August recovery.
More importantly, price failed repeatedly inside the 64.9–65.6k resistance area before breaking lower.
That gives sellers the short-term advantage.
The broader structure is less decisive. The 61.2–62.2k area remains intact and has already attracted buyers several times. Until that zone fails, the current weakness still sits inside a wider range rather than a confirmed larger breakdown.
Primary interpretation
The cautious view remains stronger while Bitcoin stays below the former rising support and the 65k resistance area.
A move toward 61.2–62.2k would be consistent with the current structure, but the reaction there matters more than reaching the zone itself.
If buyers defend it again, the market may simply be extending the range.
Alternative interpretation
The alternative is a failed breakdown.
That scenario gains credibility if Bitcoin quickly reclaims the broken trendline and then establishes four-hour acceptance above 65k.
The softer inflation backdrop and renewed ETF inflows would make such a recovery more convincing because price would finally begin confirming the external support.
What would change the current view
The bearish reading weakens above 65k.
The broader neutral structure weakens if Bitcoin loses 61.2–62.2k and cannot recover it. In that case, the 57.7–58.5k higher-time-frame demand area becomes more relevant.
What comes next
The next test is whether lower Treasury yields and a softer dollar finally produce follow-through in Bitcoin rather than only in equities and precious metals.
Bitcoin got a friendlier macro backdrop, but buyers still failed the same technical test.

Penafian
Maklumat dan penerbitan adalah tidak bertujuan, dan tidak membentuk, nasihat atau cadangan kewangan, pelaburan, dagangan atau jenis lain yang diberikan atau disahkan oleh TradingView. Baca lebih dalam Terma Penggunaan.
Penafian
Maklumat dan penerbitan adalah tidak bertujuan, dan tidak membentuk, nasihat atau cadangan kewangan, pelaburan, dagangan atau jenis lain yang diberikan atau disahkan oleh TradingView. Baca lebih dalam Terma Penggunaan.