
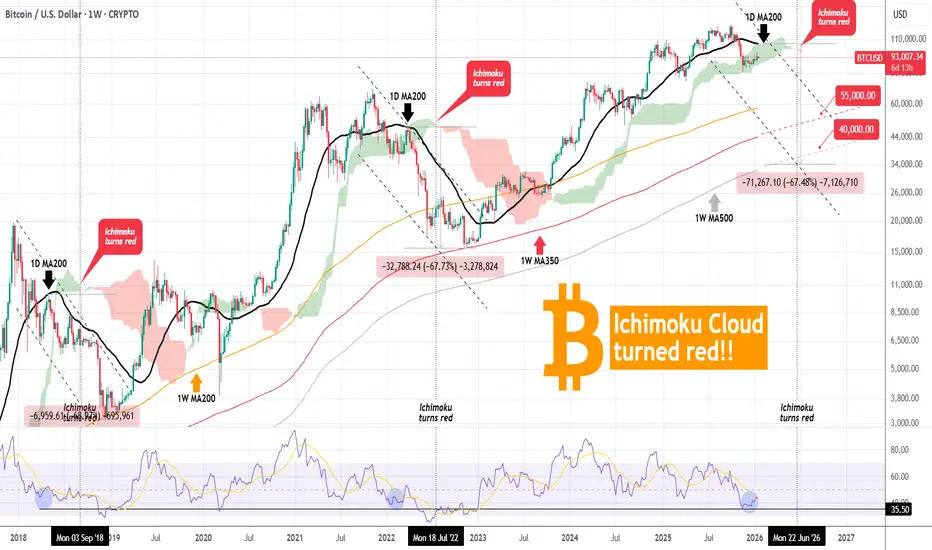
Bitcoin (BTCUSD) has turned its 1W Ichimoku Cloud red following an impressive run of more than 2 straight years of green. Historically, every time this development took place, the market was already on a Bear Cycle.
Technically this is the latest signal to confirm the 2026 Bear Cycle and the last times it took place, BTC bottomed at -68% (on all cases) from the following High rejection on the 1D MA200 (black trend-line). Based on the current position of the 1D MA200 a -68% decline would have the market test $35k.
Since however BTC bottomed on its 1W MA350 (red trend-line) during its last Bear Cycle, we should be expecting to hit it again. Based on its current trajectory, that should take place on $55000 at least. And given the fact that since 2018, every Bear Cycle bottom is a +150 MA lower on 1W (2018 bottom on 1W MA200, 2022 bottom on 1W MA350), we can assume that the 1W MA500 (grey trend-line) could get hit. That creates a potential fair bottom zone within $55000 - $40000, for use of optimistic - pessimistic scenarios.
So do you think the 1W Ichimoku Cloud turning red has confirmed the Bear Cycle? Feel free to let us know in the comments section below!
---
** Please LIKE 👍, FOLLOW ✅, SHARE 🙌 and COMMENT ✍ if you enjoy this idea! Also share your ideas and charts in the comments section below! This is best way to keep it relevant, support us, keep the content here free and allow the idea to reach as many people as possible. **
---
💸💸💸💸💸💸
👇 👇 👇 👇 👇 👇
Technically this is the latest signal to confirm the 2026 Bear Cycle and the last times it took place, BTC bottomed at -68% (on all cases) from the following High rejection on the 1D MA200 (black trend-line). Based on the current position of the 1D MA200 a -68% decline would have the market test $35k.
Since however BTC bottomed on its 1W MA350 (red trend-line) during its last Bear Cycle, we should be expecting to hit it again. Based on its current trajectory, that should take place on $55000 at least. And given the fact that since 2018, every Bear Cycle bottom is a +150 MA lower on 1W (2018 bottom on 1W MA200, 2022 bottom on 1W MA350), we can assume that the 1W MA500 (grey trend-line) could get hit. That creates a potential fair bottom zone within $55000 - $40000, for use of optimistic - pessimistic scenarios.
So do you think the 1W Ichimoku Cloud turning red has confirmed the Bear Cycle? Feel free to let us know in the comments section below!
---
** Please LIKE 👍, FOLLOW ✅, SHARE 🙌 and COMMENT ✍ if you enjoy this idea! Also share your ideas and charts in the comments section below! This is best way to keep it relevant, support us, keep the content here free and allow the idea to reach as many people as possible. **
---
💸💸💸💸💸💸
👇 👇 👇 👇 👇 👇

I trade Crypto, Forex, Indices & Commodities on PrimeXBT — all from one account with TradingView charts 👉 tradingshot.short.gy/PrimeXBT
I also use TradeNation for fixed spreads & zero commission 👉 tradingshot.short.gy/Tradenation
I also use TradeNation for fixed spreads & zero commission 👉 tradingshot.short.gy/Tradenation
Penafian
Maklumat dan penerbitan adalah tidak bertujuan, dan tidak membentuk, nasihat atau cadangan kewangan, pelaburan, dagangan atau jenis lain yang diberikan atau disahkan oleh TradingView. Baca lebih dalam Terma Penggunaan.
I trade Crypto, Forex, Indices & Commodities on PrimeXBT — all from one account with TradingView charts 👉 tradingshot.short.gy/PrimeXBT
I also use TradeNation for fixed spreads & zero commission 👉 tradingshot.short.gy/Tradenation
I also use TradeNation for fixed spreads & zero commission 👉 tradingshot.short.gy/Tradenation
Penafian
Maklumat dan penerbitan adalah tidak bertujuan, dan tidak membentuk, nasihat atau cadangan kewangan, pelaburan, dagangan atau jenis lain yang diberikan atau disahkan oleh TradingView. Baca lebih dalam Terma Penggunaan.