
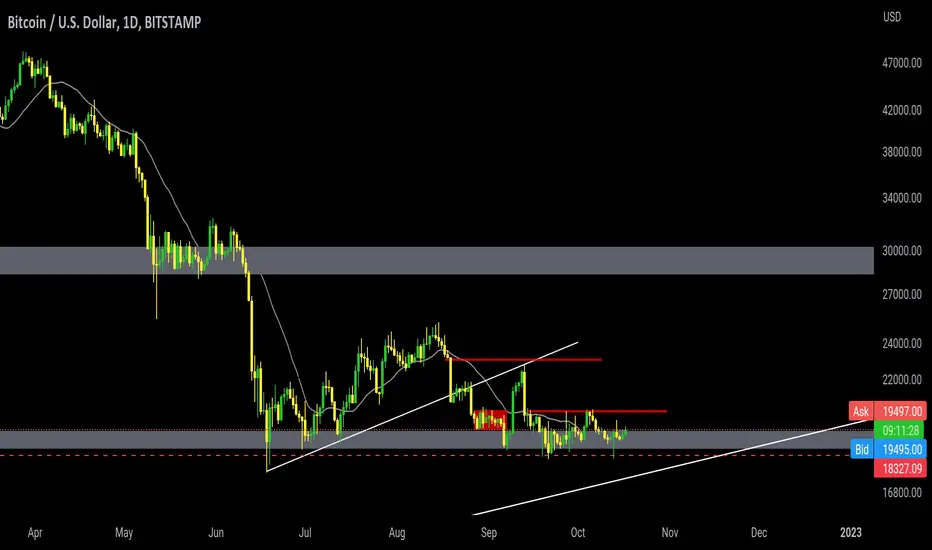
What can be seen in the chart, apart from the discussion of fundamentals, we are at the end of leg 2, and leg 2 overlaps with the break-even level, and these chats that occurred at the end of the trend can most likely be an extension Gap.
In general, this correction can be considered a pullback at the breakeven level (19,000).
But for more believers, it is possible to wait for the breakout trading range that has been specified. or looking for signal bars with good gap
The next reason is to approach the long-term trend line of the chart.

Penerbitan berkaitan
Penafian
Maklumat dan penerbitan adalah tidak bertujuan, dan tidak membentuk, nasihat atau cadangan kewangan, pelaburan, dagangan atau jenis lain yang diberikan atau disahkan oleh TradingView. Baca lebih dalam Terma Penggunaan.
Penerbitan berkaitan
Penafian
Maklumat dan penerbitan adalah tidak bertujuan, dan tidak membentuk, nasihat atau cadangan kewangan, pelaburan, dagangan atau jenis lain yang diberikan atau disahkan oleh TradingView. Baca lebih dalam Terma Penggunaan.