
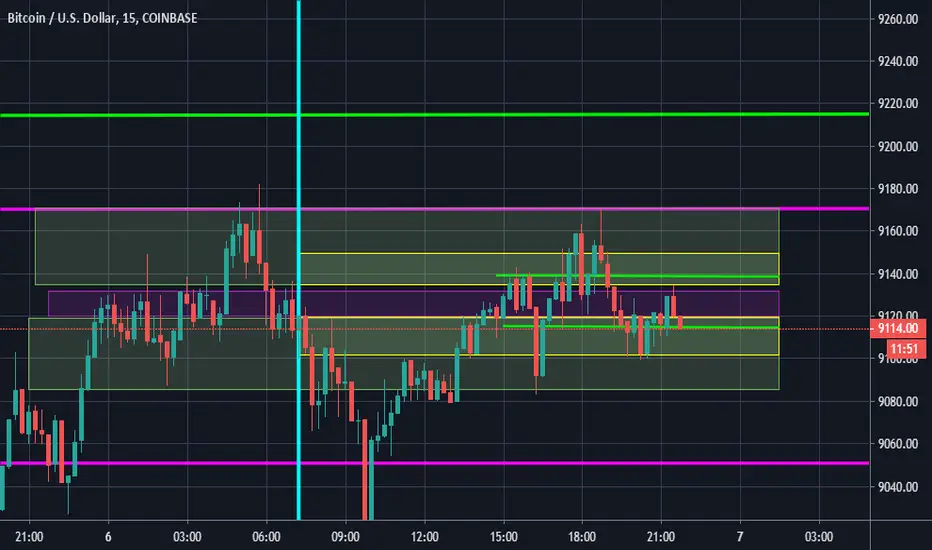
For some reason I think folks that see this already know what's happening because I really don't. The accumulation of 4 days worth of TA knowledge and 6 years worth of crypto information stacked in my head, I wrote this chart. Starting out at months and going in to within 5 minutes, making note of where the most price action happens I drew lines to represent resistance levels. The opaque areas are the ranges for the resistance levels. Within the ranges shown is a green line that determines whether the price will stay in there. If the price shoots above/below the green line, my prediction is that it will reach further into the range area. This would be for day trading and short term goals. In the longest range, I believe BTC will be #27000byJuly

Penafian
Maklumat dan penerbitan adalah tidak bertujuan, dan tidak membentuk, nasihat atau cadangan kewangan, pelaburan, dagangan atau jenis lain yang diberikan atau disahkan oleh TradingView. Baca lebih dalam Terma Penggunaan.
Penafian
Maklumat dan penerbitan adalah tidak bertujuan, dan tidak membentuk, nasihat atau cadangan kewangan, pelaburan, dagangan atau jenis lain yang diberikan atau disahkan oleh TradingView. Baca lebih dalam Terma Penggunaan.