
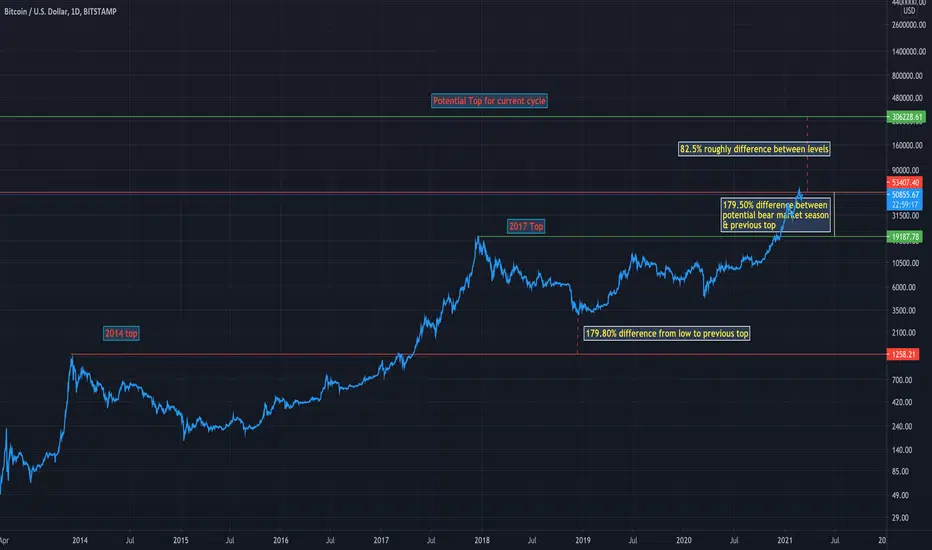
This chart has been drawn out by looking at the 2014 and 2017 tops and looking at the % difference between the 2017 LOWS comparing to the 2014 top.
Taking this difference, we can say from 2017 top we have a potential LOW for where we should be sitting at for a bear season low.
From there we can say the rally between 2014 and 2017 was 1400% which puts us roughly at $306,000. Calculating the down side in the 2017 bear season, it fell roughly 87%, if we are saying $306,000 is the top, then 85% retracement would put us roughly in the $42k BTC range.
Taking this difference, we can say from 2017 top we have a potential LOW for where we should be sitting at for a bear season low.
From there we can say the rally between 2014 and 2017 was 1400% which puts us roughly at $306,000. Calculating the down side in the 2017 bear season, it fell roughly 87%, if we are saying $306,000 is the top, then 85% retracement would put us roughly in the $42k BTC range.

Penafian
Maklumat dan penerbitan adalah tidak bertujuan, dan tidak membentuk, nasihat atau cadangan kewangan, pelaburan, dagangan atau jenis lain yang diberikan atau disahkan oleh TradingView. Baca lebih dalam Terma Penggunaan.
Penafian
Maklumat dan penerbitan adalah tidak bertujuan, dan tidak membentuk, nasihat atau cadangan kewangan, pelaburan, dagangan atau jenis lain yang diberikan atau disahkan oleh TradingView. Baca lebih dalam Terma Penggunaan.