
Why Price Keeps Returning to Certain Areas Before Choosing Its Next Direction
A market can move hundreds of points in one direction, yet somehow find its way back toward the same price area again and again.
At first, this looks strange.
If buyers have taken control, why doesn't price simply continue higher? Why does it repeatedly come back toward an old trading area before making another move?
One useful way to understand this behavior is through the concept of equilibrium.
Markets constantly move between areas where buyers and sellers are relatively balanced and areas where one side becomes dominant. Tools such as VWAP, Volume Profile and value areas can help visualize this changing balance.
The important part is not predicting that price must return to these areas. It is understanding why certain prices become important reference points.
Equilibrium Is Where the Market Agrees
Imagine an auction.
Buyers want lower prices. Sellers want higher prices. Transactions happen when the two sides find prices acceptable enough to trade.
When a market spends a significant amount of time trading around a particular region, that region can become an area of accepted value.
Price may move above it.
Price may move below it.
But if neither side can maintain control, the market repeatedly gravitates back toward the same zone.
This is the basic idea behind market equilibrium.
It doesn't mean that price is mathematically destined to return.
It means that the market has demonstrated significant two-sided activity around that area.
VWAP: A Moving Reference Point
One of the simplest ways to observe this concept is through VWAP, or Volume Weighted Average Price.
VWAP represents the average price traded during a particular session or period, weighted by volume.
Think of it as a continuously updating reference point for where significant trading activity has taken place.
When price moves far away from VWAP, several things can happen.
It can:
continue moving as the imbalance strengthens,
consolidate at the new level,
or return toward VWAP.
That last behavior is where traders often notice what appears to be a market "magnet."
But calling VWAP a magnet can be misleading.
VWAP does not pull price toward itself.
Instead, VWAP reflects where trading activity has occurred, and price returning toward it can represent a return toward a commonly traded reference price.
That's an important distinction.
Value Areas: Where Trading Concentrates
VWAP gives us one reference point.
Volume Profile gives us a broader picture.
A volume profile shows how much trading occurred at different price levels rather than simply displaying volume over time.
From this, traders can identify areas such as:
Value Area
The range containing a large proportion of the session's traded volume.
Point of Control (POC)
The price level with the highest traded volume within the selected profile.
These areas can become important because they reveal where the market spent considerable effort exchanging positions.
Suppose price breaks sharply above a previous value area.
There are now two possibilities.
The market could accept higher prices, spending time and building new volume above the old range.
Or it could reject higher prices, quickly falling back into the previous value area.
The difference between those two behaviors is often more informative than the initial breakout itself.
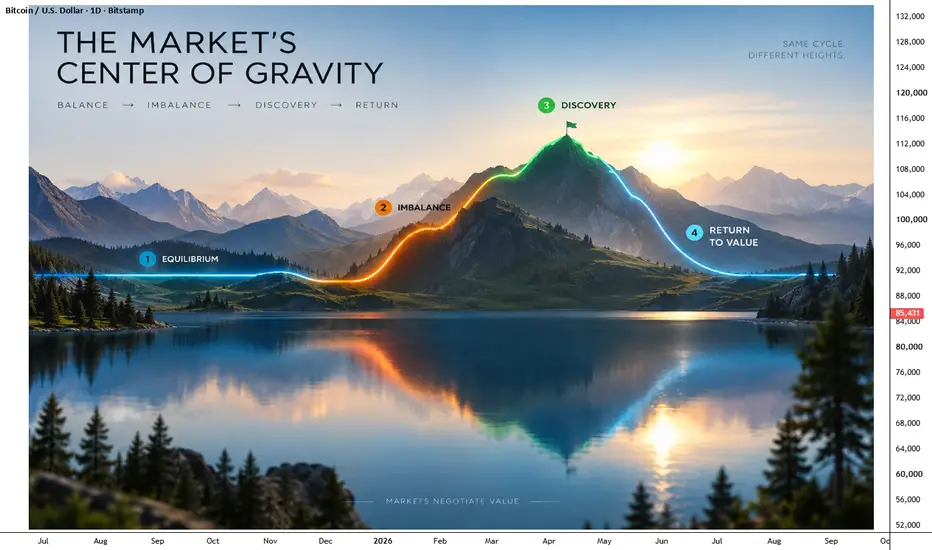
The Four-Stage Market Cycle
A useful way to combine these ideas is to think of price movement as a repeating sequence.
1. Equilibrium
Price trades inside a relatively stable range.
Volume builds.
VWAP remains close to the center of activity.
Neither buyers nor sellers have established lasting control.
This is where the market is essentially saying:
"This price is acceptable."
2. Imbalance
Suddenly, one side becomes more aggressive.
Price leaves the established value area.
The market is no longer comfortable trading at the previous equilibrium.
This creates displacement.
But displacement alone doesn't prove that a new trend has begun.
That's where many traders make their mistake.
They see price leave the range and immediately assume:
Breakout = trend.
Not necessarily.
3. Discovery
Price begins searching for a new area where transactions can occur.
If buyers remain aggressive, price may continue higher.
If sellers absorb the buying pressure, the move can stall.
The market is essentially searching for a new equilibrium.
This is why strong trends often contain pauses.
The market isn't necessarily reversing.
It may simply be establishing a new area of value.
4. Reversion or Acceptance
Eventually, the market reveals whether the new price level is being accepted.
If price builds volume above the previous value area, the market may establish a new equilibrium higher.
If price quickly falls back into the old value area, the breakout may have failed.
And if price continues moving through the old equilibrium without meaningful acceptance, the market may be transitioning into another phase of discovery.
This creates a useful question:
Is price returning to value, or is it creating new value?
That question is often more useful than simply asking whether price is bullish or bearish.
Why Price Can "Orbit" Around Certain Levels
Here's where the idea of a center of gravity becomes useful as an analogy.
Imagine a planet orbiting a gravitational center.
Price obviously does not obey physical gravity.
But visually, some markets behave as though certain price regions have greater "gravitational importance" because they contain substantial historical trading activity.
A heavily traded region can become a reference point.
Price moves away.
Traders react.
Positions are adjusted.
Liquidity changes.
Price may return.
Then the process begins again.
The important point is that the center itself can move.
If buyers consistently accept higher prices, the market can build a new high-volume region.
The old center loses importance.
A new center develops.
So instead of thinking:
"Price always comes back to VWAP."
Think:
"Markets can repeatedly search for equilibrium after periods of imbalance."
That is a much more useful framework.
The Most Interesting Part: The Return
The return toward value is not necessarily the trading opportunity.
The reaction at the return can be more informative.
Consider this sequence:
Equilibrium → breakout → strong move → return to value
Now observe what happens when price reaches the old equilibrium.
Scenario A: Immediate rejection
Price touches the old value region and quickly moves away.
This suggests the market may still be operating with an imbalance.
Scenario B: Acceptance
Price returns to the old value region and begins trading there again.
Now the previous breakout has lost some of its significance.
The market may be returning to balance.
Scenario C: Breakdown
Price returns to value, moves through it and begins accepting lower prices.
The market may be transitioning toward a new equilibrium below.
The same level can therefore produce completely different outcomes.
The level is not the signal. The behavior around the level is the information.
A Simple Framework for Traders
Instead of blindly buying VWAP touches or trading every POC retest, use a sequence of questions.
1. Where is the current equilibrium?
Look at VWAP, value areas, consolidation, and volume concentration.
2. Has price actually left that equilibrium?
A small excursion isn't necessarily a meaningful displacement.
3. Is the new area being accepted?
Look for continued trading and volume development rather than a single candle.
4. If price returns, what happens?
Does it reject the old value?
Does it get absorbed?
Does it begin trading inside the previous range?
5. Where is the new equilibrium forming?
This final question is often overlooked.
The objective isn't simply to identify where price was balanced.
It is to recognize when the market is building a new balance point.
The Bigger Lesson
Technical analysis is often taught as a collection of patterns:
Support.
Resistance.
Breakout.
Pullback.
VWAP.
Volume Profile.
But these tools become much more useful when viewed through a common framework.
Markets alternate between balance and imbalance.
Balance creates areas of accepted value.
Imbalance pushes price away from them.
Price then either continues searching for a new area of acceptance or returns toward the previous one.
This explains why a market can trend strongly while still repeatedly revisiting old prices.
The market isn't necessarily "confused."
It is constantly negotiating value.
And perhaps the better question for a trader isn't:
"Where will price go next?" But "where is the market currently in equilibrium, and what evidence would prove that equilibrium has shifted"
By BrightRally_Research
A market can move hundreds of points in one direction, yet somehow find its way back toward the same price area again and again.
At first, this looks strange.
If buyers have taken control, why doesn't price simply continue higher? Why does it repeatedly come back toward an old trading area before making another move?
One useful way to understand this behavior is through the concept of equilibrium.
Markets constantly move between areas where buyers and sellers are relatively balanced and areas where one side becomes dominant. Tools such as VWAP, Volume Profile and value areas can help visualize this changing balance.
The important part is not predicting that price must return to these areas. It is understanding why certain prices become important reference points.
Equilibrium Is Where the Market Agrees
Imagine an auction.
Buyers want lower prices. Sellers want higher prices. Transactions happen when the two sides find prices acceptable enough to trade.
When a market spends a significant amount of time trading around a particular region, that region can become an area of accepted value.
Price may move above it.
Price may move below it.
But if neither side can maintain control, the market repeatedly gravitates back toward the same zone.
This is the basic idea behind market equilibrium.
It doesn't mean that price is mathematically destined to return.
It means that the market has demonstrated significant two-sided activity around that area.
VWAP: A Moving Reference Point
One of the simplest ways to observe this concept is through VWAP, or Volume Weighted Average Price.
VWAP represents the average price traded during a particular session or period, weighted by volume.
Think of it as a continuously updating reference point for where significant trading activity has taken place.
When price moves far away from VWAP, several things can happen.
It can:
continue moving as the imbalance strengthens,
consolidate at the new level,
or return toward VWAP.
That last behavior is where traders often notice what appears to be a market "magnet."
But calling VWAP a magnet can be misleading.
VWAP does not pull price toward itself.
Instead, VWAP reflects where trading activity has occurred, and price returning toward it can represent a return toward a commonly traded reference price.
That's an important distinction.
Value Areas: Where Trading Concentrates
VWAP gives us one reference point.
Volume Profile gives us a broader picture.
A volume profile shows how much trading occurred at different price levels rather than simply displaying volume over time.
From this, traders can identify areas such as:
Value Area
The range containing a large proportion of the session's traded volume.
Point of Control (POC)
The price level with the highest traded volume within the selected profile.
These areas can become important because they reveal where the market spent considerable effort exchanging positions.
Suppose price breaks sharply above a previous value area.
There are now two possibilities.
The market could accept higher prices, spending time and building new volume above the old range.
Or it could reject higher prices, quickly falling back into the previous value area.
The difference between those two behaviors is often more informative than the initial breakout itself.
The Four-Stage Market Cycle
A useful way to combine these ideas is to think of price movement as a repeating sequence.
1. Equilibrium
Price trades inside a relatively stable range.
Volume builds.
VWAP remains close to the center of activity.
Neither buyers nor sellers have established lasting control.
This is where the market is essentially saying:
"This price is acceptable."
2. Imbalance
Suddenly, one side becomes more aggressive.
Price leaves the established value area.
The market is no longer comfortable trading at the previous equilibrium.
This creates displacement.
But displacement alone doesn't prove that a new trend has begun.
That's where many traders make their mistake.
They see price leave the range and immediately assume:
Breakout = trend.
Not necessarily.
3. Discovery
Price begins searching for a new area where transactions can occur.
If buyers remain aggressive, price may continue higher.
If sellers absorb the buying pressure, the move can stall.
The market is essentially searching for a new equilibrium.
This is why strong trends often contain pauses.
The market isn't necessarily reversing.
It may simply be establishing a new area of value.
4. Reversion or Acceptance
Eventually, the market reveals whether the new price level is being accepted.
If price builds volume above the previous value area, the market may establish a new equilibrium higher.
If price quickly falls back into the old value area, the breakout may have failed.
And if price continues moving through the old equilibrium without meaningful acceptance, the market may be transitioning into another phase of discovery.
This creates a useful question:
Is price returning to value, or is it creating new value?
That question is often more useful than simply asking whether price is bullish or bearish.
Why Price Can "Orbit" Around Certain Levels
Here's where the idea of a center of gravity becomes useful as an analogy.
Imagine a planet orbiting a gravitational center.
Price obviously does not obey physical gravity.
But visually, some markets behave as though certain price regions have greater "gravitational importance" because they contain substantial historical trading activity.
A heavily traded region can become a reference point.
Price moves away.
Traders react.
Positions are adjusted.
Liquidity changes.
Price may return.
Then the process begins again.
The important point is that the center itself can move.
If buyers consistently accept higher prices, the market can build a new high-volume region.
The old center loses importance.
A new center develops.
So instead of thinking:
"Price always comes back to VWAP."
Think:
"Markets can repeatedly search for equilibrium after periods of imbalance."
That is a much more useful framework.
The Most Interesting Part: The Return
The return toward value is not necessarily the trading opportunity.
The reaction at the return can be more informative.
Consider this sequence:
Equilibrium → breakout → strong move → return to value
Now observe what happens when price reaches the old equilibrium.
Scenario A: Immediate rejection
Price touches the old value region and quickly moves away.
This suggests the market may still be operating with an imbalance.
Scenario B: Acceptance
Price returns to the old value region and begins trading there again.
Now the previous breakout has lost some of its significance.
The market may be returning to balance.
Scenario C: Breakdown
Price returns to value, moves through it and begins accepting lower prices.
The market may be transitioning toward a new equilibrium below.
The same level can therefore produce completely different outcomes.
The level is not the signal. The behavior around the level is the information.
A Simple Framework for Traders
Instead of blindly buying VWAP touches or trading every POC retest, use a sequence of questions.
1. Where is the current equilibrium?
Look at VWAP, value areas, consolidation, and volume concentration.
2. Has price actually left that equilibrium?
A small excursion isn't necessarily a meaningful displacement.
3. Is the new area being accepted?
Look for continued trading and volume development rather than a single candle.
4. If price returns, what happens?
Does it reject the old value?
Does it get absorbed?
Does it begin trading inside the previous range?
5. Where is the new equilibrium forming?
This final question is often overlooked.
The objective isn't simply to identify where price was balanced.
It is to recognize when the market is building a new balance point.
The Bigger Lesson
Technical analysis is often taught as a collection of patterns:
Support.
Resistance.
Breakout.
Pullback.
VWAP.
Volume Profile.
But these tools become much more useful when viewed through a common framework.
Markets alternate between balance and imbalance.
Balance creates areas of accepted value.
Imbalance pushes price away from them.
Price then either continues searching for a new area of acceptance or returns toward the previous one.
This explains why a market can trend strongly while still repeatedly revisiting old prices.
The market isn't necessarily "confused."
It is constantly negotiating value.
And perhaps the better question for a trader isn't:
"Where will price go next?" But "where is the market currently in equilibrium, and what evidence would prove that equilibrium has shifted"
By BrightRally_Research

Penerbitan berkaitan
Penafian
Maklumat dan penerbitan adalah tidak bertujuan, dan tidak membentuk, nasihat atau cadangan kewangan, pelaburan, dagangan atau jenis lain yang diberikan atau disahkan oleh TradingView. Baca lebih dalam Terma Penggunaan.
Penerbitan berkaitan
Penafian
Maklumat dan penerbitan adalah tidak bertujuan, dan tidak membentuk, nasihat atau cadangan kewangan, pelaburan, dagangan atau jenis lain yang diberikan atau disahkan oleh TradingView. Baca lebih dalam Terma Penggunaan.