
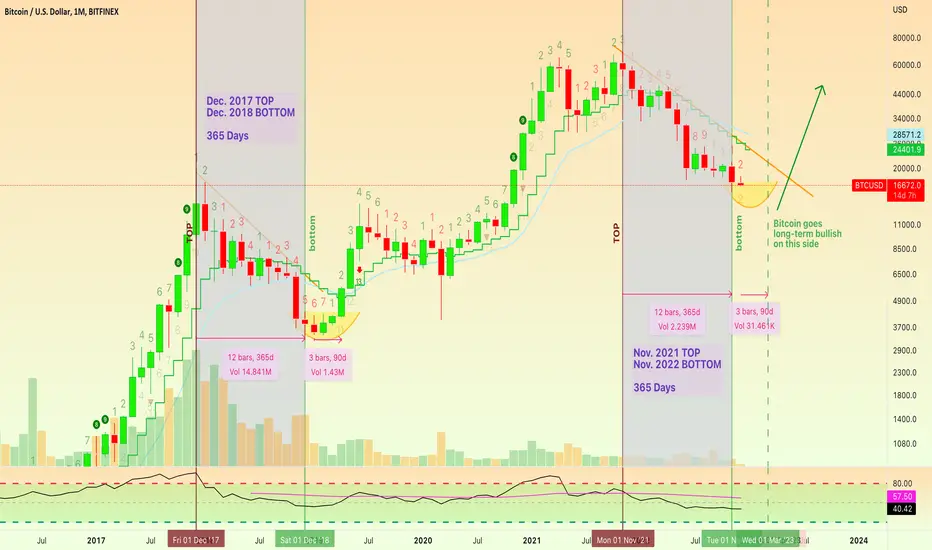
- Back in December 2017 bitcoin peaked hitting an All-Time High and bottomed December 2018 after 365 days.
- Back in November 2021 bitcoin peaked hitting a new All-Time High and hit a multi-year low November 2022 after 365 days.
After the 2018 low was hit it took three months of consolidation before the bullish breakout/start of bull market.
Following this same pattern, three months consolidation would put us in late March for a bullish breakout/start of bull market... If the same pattern repeats.
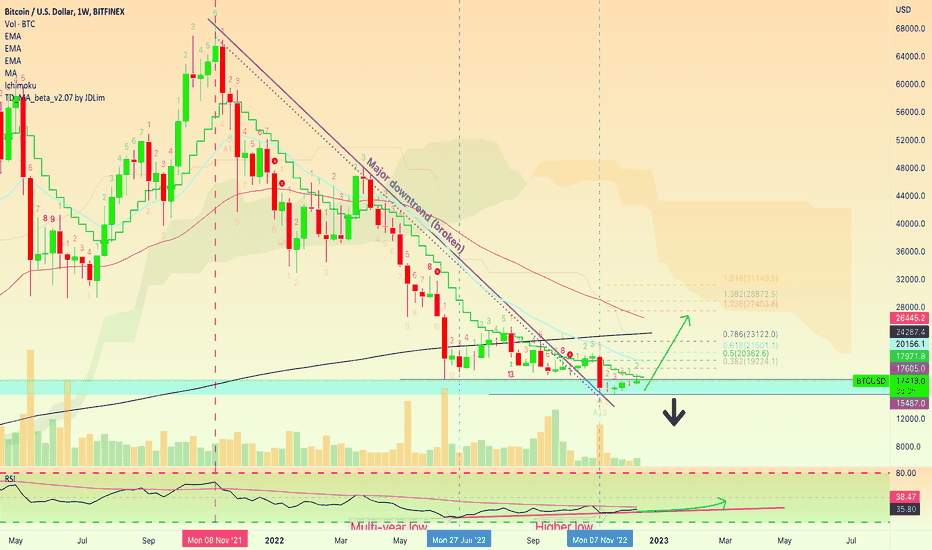
The bottom is not yet confirmed as it can take 2-3 months for confirmation after a new low is hit yet the long-term downtrend has been broken as shown in the article below:
🅱️ Bitcoin Breaks Free - Major Nov. 2021 Downtrend | Linear Scale | 15-Dec-2022
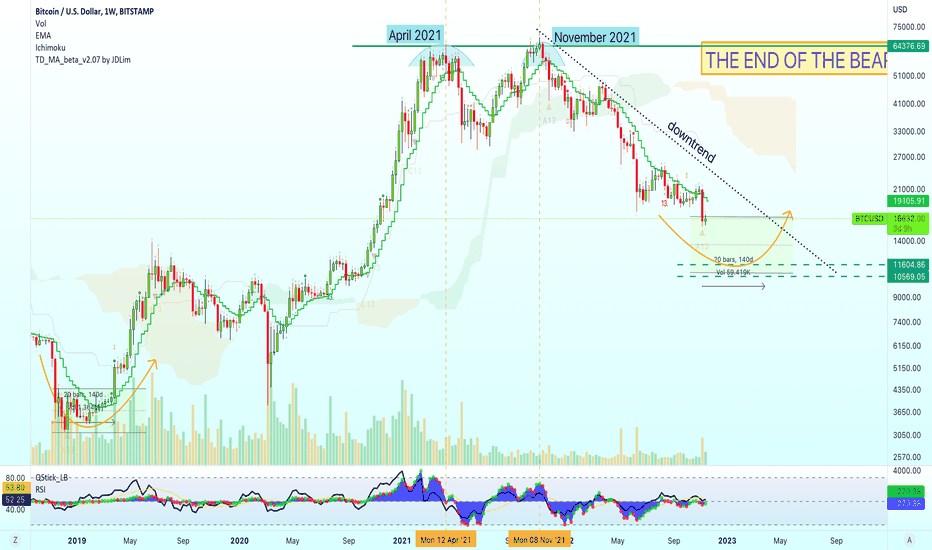
This article is also relevant for today's topic:
🅱️ Bitcoin Bear Market Bottom + Recovery (1-5 Months) | 17-Nov-2022
Bitcoin's performance in January since 2012
This is how bitcoin has been performing every January for the past 11 years.
What is your opinion about this?
Leave a comment.
Namaste.
- Back in November 2021 bitcoin peaked hitting a new All-Time High and hit a multi-year low November 2022 after 365 days.
After the 2018 low was hit it took three months of consolidation before the bullish breakout/start of bull market.
Following this same pattern, three months consolidation would put us in late March for a bullish breakout/start of bull market... If the same pattern repeats.
The bottom is not yet confirmed as it can take 2-3 months for confirmation after a new low is hit yet the long-term downtrend has been broken as shown in the article below:
🅱️ Bitcoin Breaks Free - Major Nov. 2021 Downtrend | Linear Scale | 15-Dec-2022
This article is also relevant for today's topic:
🅱️ Bitcoin Bear Market Bottom + Recovery (1-5 Months) | 17-Nov-2022
Bitcoin's performance in January since 2012
This is how bitcoin has been performing every January for the past 11 years.
- January 2012 (+15.72%)
- January 2013 (+54.53%)
- January 2014 (+8.92%)
- January 2015 (-33.04%)
- January 2016 (-14.80%)
- January 2017(-0.04%)
- January 2018 (-25.43%)
- January 2019 (-8.53%)
- January 2020 (+29.95%)
- January 2021 (+14.51%)
- January 2022 (-16.70%)
What is your opinion about this?
Leave a comment.
Namaste.

💯 Trading signals (results)
— Late 2026👇
t.me/masteranandatrades/9279
🔥 10-25X Leverage
—Trade-numbers:
t.me/masteranandatrades/9271
✅ PREMIUM &Content
—One-Time Payment
t.me/lamatrades/4 (🔝 since 2017)
— Late 2026👇
t.me/masteranandatrades/9279
🔥 10-25X Leverage
—Trade-numbers:
t.me/masteranandatrades/9271
✅ PREMIUM &Content
—One-Time Payment
t.me/lamatrades/4 (🔝 since 2017)
Penerbitan berkaitan
Penafian
Maklumat dan penerbitan adalah tidak bertujuan, dan tidak membentuk, nasihat atau cadangan kewangan, pelaburan, dagangan atau jenis lain yang diberikan atau disahkan oleh TradingView. Baca lebih dalam Terma Penggunaan.