
The Macro Picture 🗺️
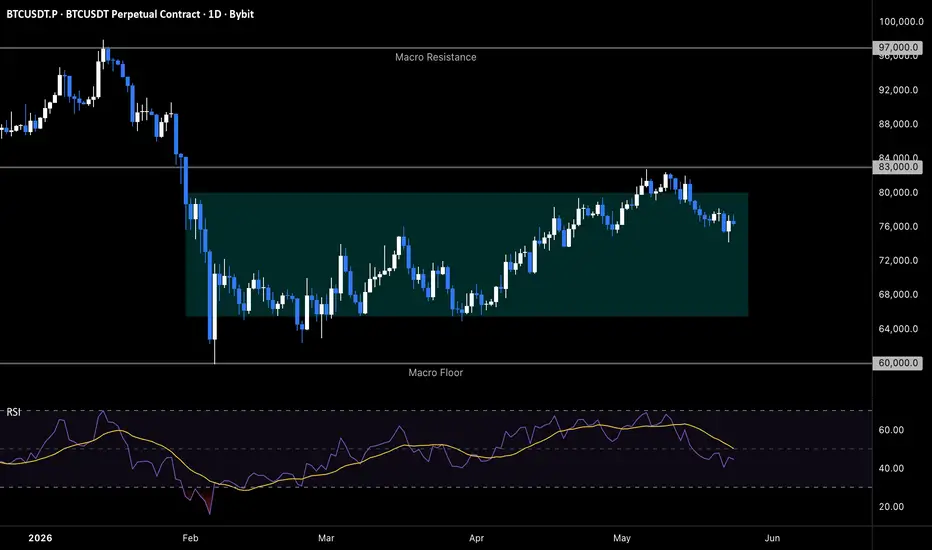
Bitcoin has been carving out a wide structural reset between the $97,000 macro ceiling and the $60,000 macro floor — a four-month accumulation pocket that desperately needs to be tested in both directions before the next directional leg can resolve. The green zone marked on the chart between $66,000 and $80,000 is a volatility playground where bulls and bears have been trading control without conviction. Price now sits at $77,000 after a clean rejection at the $83,000 local high, signaling that the upper boundary of the recovery channel has done its job.
The Setup ⚙️
The Ceiling: The $83,000 zone marked the structural peak of the recovery leg from February's flush, and bears are defending it with conviction — RSI rolling off 60 confirms the momentum exhaustion on this local push.
The Range Play: The zone between $66,000 and $80,000 creates a structural playground for grid-based accumulation, where systematic oscillation between range boundaries becomes the path of least resistance until either macro level breaks.
The Reaction: Bulls are now defending $76,000 as the first reactive layer — losing this support opens a clean route toward the mid-range pocket where deeper demand sits stacked from March's base-building sequence.
The Roadmap: Primary target sits at $72,000 — the mid-range equilibrium where prior consolidation built the foundation for April's recovery leg. Invalidation: a sustained 2D close above $83,000 would invalidate this bearish thesis and trigger a renewed push toward the $88,000 macro ceiling.
Bitcoin has been carving out a wide structural reset between the $97,000 macro ceiling and the $60,000 macro floor — a four-month accumulation pocket that desperately needs to be tested in both directions before the next directional leg can resolve. The green zone marked on the chart between $66,000 and $80,000 is a volatility playground where bulls and bears have been trading control without conviction. Price now sits at $77,000 after a clean rejection at the $83,000 local high, signaling that the upper boundary of the recovery channel has done its job.
The Setup ⚙️
The Ceiling: The $83,000 zone marked the structural peak of the recovery leg from February's flush, and bears are defending it with conviction — RSI rolling off 60 confirms the momentum exhaustion on this local push.
The Range Play: The zone between $66,000 and $80,000 creates a structural playground for grid-based accumulation, where systematic oscillation between range boundaries becomes the path of least resistance until either macro level breaks.
The Reaction: Bulls are now defending $76,000 as the first reactive layer — losing this support opens a clean route toward the mid-range pocket where deeper demand sits stacked from March's base-building sequence.
The Roadmap: Primary target sits at $72,000 — the mid-range equilibrium where prior consolidation built the foundation for April's recovery leg. Invalidation: a sustained 2D close above $83,000 would invalidate this bearish thesis and trigger a renewed push toward the $88,000 macro ceiling.

📈 Stop guessing your settings — backtest & optimize with QuantPilot
🎁 Free to start
🎁 Free to start
Penafian
Maklumat dan penerbitan adalah tidak bertujuan, dan tidak membentuk, nasihat atau cadangan kewangan, pelaburan, dagangan atau jenis lain yang diberikan atau disahkan oleh TradingView. Baca lebih dalam Terma Penggunaan.
📈 Stop guessing your settings — backtest & optimize with QuantPilot
🎁 Free to start
🎁 Free to start
Penafian
Maklumat dan penerbitan adalah tidak bertujuan, dan tidak membentuk, nasihat atau cadangan kewangan, pelaburan, dagangan atau jenis lain yang diberikan atau disahkan oleh TradingView. Baca lebih dalam Terma Penggunaan.