
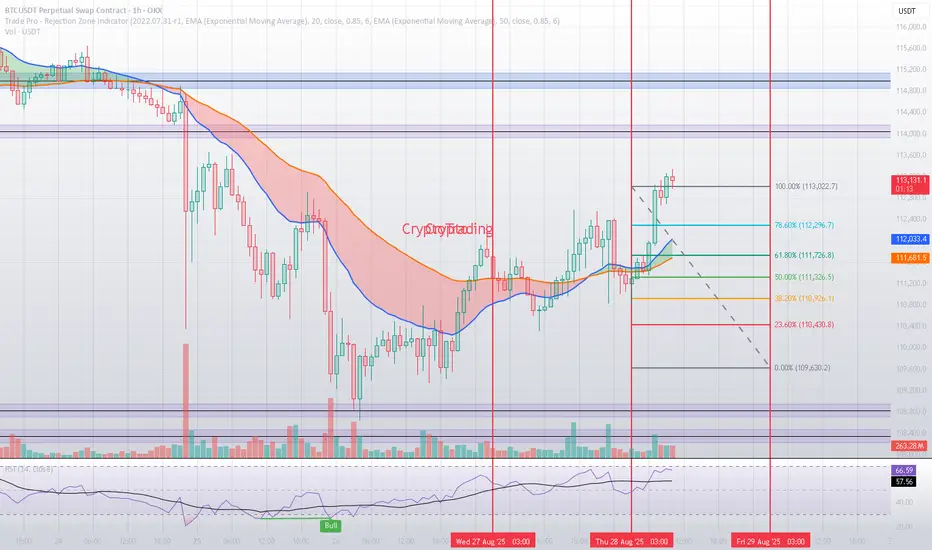
Based on mathematical and statistical models, along with Fibonacci retracement levels and moving averages, Bitcoin is currently trading near the $113,000 area. The recent bullish momentum has pushed the price upward, but the market now faces key pivot levels that will determine the next move.
🔹 Key Resistance Levels
$114,047.7: The first major resistance. A clear breakout above this level could fuel further bullish momentum. 🚀
$114,995.1: A critical resistance both technically and psychologically. Surpassing this level would likely open the way towards $115,800 – $116,000, confirming the strength of the current uptrend.
🔹 Major Support Levels
$108,829: A crucial support zone. If broken, short-term market sentiment may shift from bullish to neutral. 🛡️
$108,349: A stronger support level. A breakdown here could trigger a move toward $107,000 or even lower.
📈 Indicator Insights
The RSI is hovering near 66, suggesting the market is gradually entering overbought territory. This highlights the importance of the resistance zones, where profit-taking could occur.
The 20 & 50 EMA lines are showing a bullish crossover, supporting upward momentum as long as support levels hold.
🟢 Bullish Scenario
If the price breaks above $114,047.7 and then $114,995.1, Bitcoin could quickly advance toward $115,800 – $116,000 in the short term.
🔴 Bearish Scenario
Failure to sustain above $113,000 could lead to a pullback, with $108,829 as the first line of defense, followed by the stronger support at $108,349. A breakdown below this zone would turn the short-term outlook bearish.
✅ Conclusion
Bitcoin is at a decisive point: strong resistance lies between $114K – $115K, while robust supports are clustered near $108K. A breakout or breakdown from these levels will set the tone for the next major move. Until then, risk management remains essential. ⚖️
🔹 Key Resistance Levels
$114,047.7: The first major resistance. A clear breakout above this level could fuel further bullish momentum. 🚀
$114,995.1: A critical resistance both technically and psychologically. Surpassing this level would likely open the way towards $115,800 – $116,000, confirming the strength of the current uptrend.
🔹 Major Support Levels
$108,829: A crucial support zone. If broken, short-term market sentiment may shift from bullish to neutral. 🛡️
$108,349: A stronger support level. A breakdown here could trigger a move toward $107,000 or even lower.
📈 Indicator Insights
The RSI is hovering near 66, suggesting the market is gradually entering overbought territory. This highlights the importance of the resistance zones, where profit-taking could occur.
The 20 & 50 EMA lines are showing a bullish crossover, supporting upward momentum as long as support levels hold.
🟢 Bullish Scenario
If the price breaks above $114,047.7 and then $114,995.1, Bitcoin could quickly advance toward $115,800 – $116,000 in the short term.
🔴 Bearish Scenario
Failure to sustain above $113,000 could lead to a pullback, with $108,829 as the first line of defense, followed by the stronger support at $108,349. A breakdown below this zone would turn the short-term outlook bearish.
✅ Conclusion
Bitcoin is at a decisive point: strong resistance lies between $114K – $115K, while robust supports are clustered near $108K. A breakout or breakdown from these levels will set the tone for the next major move. Until then, risk management remains essential. ⚖️
Nota
💡 Important NoteBitcoin is currently trading above the 100% Fibonacci level and above $113,022.7, which is a strong indicator of bullish momentum 🚀.
However, caution is required ⚠️ — at these levels, the market may be entering a FOMO trap. Within just 2 to 5 minutes, we could see a sharp pullback to lower levels.
Please exercise extra caution and apply strict risk management when trading around these critical zones. ⚖️

Penafian
Maklumat dan penerbitan adalah tidak bertujuan, dan tidak membentuk, nasihat atau cadangan kewangan, pelaburan, dagangan atau jenis lain yang diberikan atau disahkan oleh TradingView. Baca lebih dalam Terma Penggunaan.
Penafian
Maklumat dan penerbitan adalah tidak bertujuan, dan tidak membentuk, nasihat atau cadangan kewangan, pelaburan, dagangan atau jenis lain yang diberikan atau disahkan oleh TradingView. Baca lebih dalam Terma Penggunaan.