
Hello, traders!
Follow us to get the latest information quickly.
Have a great day.
-------------------------------------
#BTCUSDT
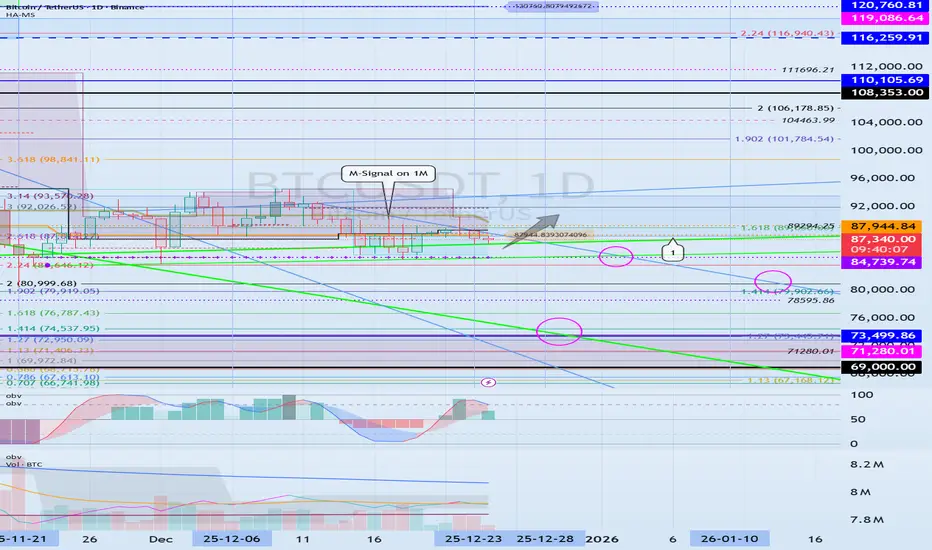
This volatility period will end on December 24th, and the next one will be around January 10th, 2026.
However, it's important to observe the movement after the newly formed trend line passes around December 28th.
The rising trend line (1) is drawn on the 1W chart. The key is whether it can rise along this trend line and break out of the short-term downtrend line.
The low point is 84739.74-87944.84, so a bullish trend is likely to occur if the price finds support near this level and rises above the M-Signal indicator on the 1M chart.
To break above this key point or level and continue the uptrend, the StochRSI, TC, and OBV indicators must show upward trends.
If possible,
1. The StochRSI indicator should not have entered the overbought zone.
2. The TC indicator should remain above zero.
3. The OBV indicator should remain above the High Line.
Therefore, we need to determine if the above conditions can be met while finding support near the low point (84739.74-87944.84).
The most important support and resistance level is 69000-73499.86.
Therefore, volatility may occur as the price approaches this level.
If support is found at this level, I believe it's definitely a good time to buy.
I believe the price level we won't see again is below 42K.
-
Thank you for reading to the end.
I wish you successful trading.
--------------------------------------------------
- This is an explanation of the big picture.
(3-year bull market, 1-year bear market pattern)
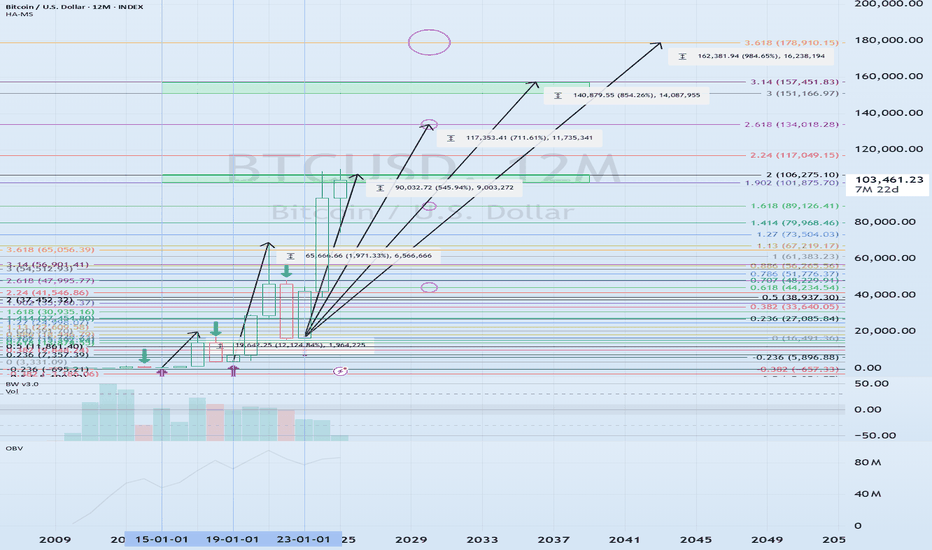
I will explain in more detail when the bear market begins.
------------------------------------------------------
Dagangan aktif
#BTCUSDTThis period of volatility is expected to last until December 29th.
The key to this period of volatility is whether the price can rise along the rising trend line (1).
If the price falls below the rising trend line (1) and holds, further declines are likely, so we need to consider countermeasures.
The decline is likely to begin with a drop below 84739.74.

YouTube: youtube.com/@readcrypto9837
※ Follow X to check out the posts.
※ X를 팔로우하고 게시물을 확인하세요.
◆ t.me/readCryptoChannel
[HA-MS Indicator]
bit.ly/3YxHgvN
[OBV Indicator]
bit.ly/4dcyny3
※ Follow X to check out the posts.
※ X를 팔로우하고 게시물을 확인하세요.
◆ t.me/readCryptoChannel
[HA-MS Indicator]
bit.ly/3YxHgvN
[OBV Indicator]
bit.ly/4dcyny3
Penerbitan berkaitan
Penafian
Maklumat dan penerbitan adalah tidak bertujuan, dan tidak membentuk, nasihat atau cadangan kewangan, pelaburan, dagangan atau jenis lain yang diberikan atau disahkan oleh TradingView. Baca lebih dalam Terma Penggunaan.
YouTube: youtube.com/@readcrypto9837
※ Follow X to check out the posts.
※ X를 팔로우하고 게시물을 확인하세요.
◆ t.me/readCryptoChannel
[HA-MS Indicator]
bit.ly/3YxHgvN
[OBV Indicator]
bit.ly/4dcyny3
※ Follow X to check out the posts.
※ X를 팔로우하고 게시물을 확인하세요.
◆ t.me/readCryptoChannel
[HA-MS Indicator]
bit.ly/3YxHgvN
[OBV Indicator]
bit.ly/4dcyny3
Penerbitan berkaitan
Penafian
Maklumat dan penerbitan adalah tidak bertujuan, dan tidak membentuk, nasihat atau cadangan kewangan, pelaburan, dagangan atau jenis lain yang diberikan atau disahkan oleh TradingView. Baca lebih dalam Terma Penggunaan.