
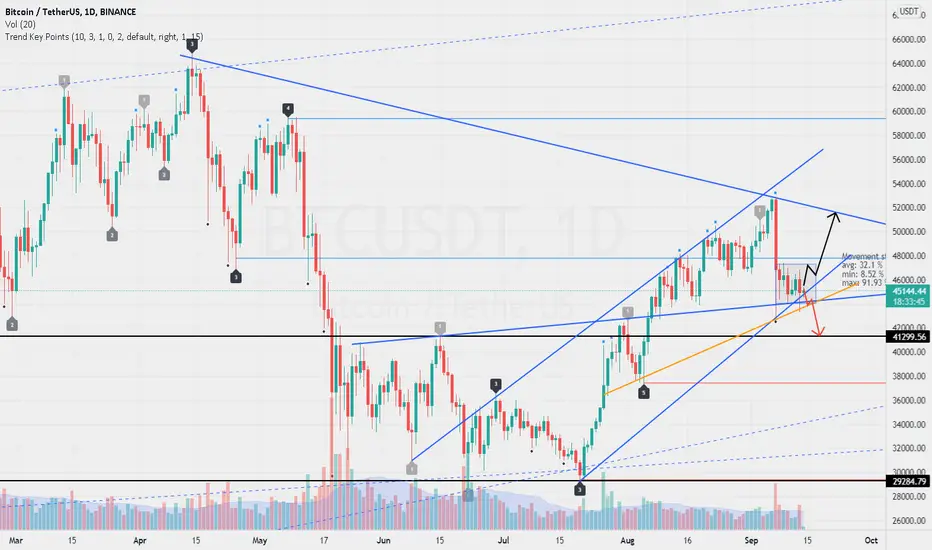
$44k is the most important support near. Its breakdown could pull the price around $41k.
The rectangle is drawn on the 1-hour time frame, I expect it to break upwards with a resistance. If so, the next stop will be between $50k and $51k.
Trend Key Points Indicator have been used to draw important key levels and key points.
The rectangle is drawn on the 1-hour time frame, I expect it to break upwards with a resistance. If so, the next stop will be between $50k and $51k.
Trend Key Points Indicator have been used to draw important key levels and key points.

Penerbitan berkaitan
Penafian
Maklumat dan penerbitan adalah tidak bertujuan, dan tidak membentuk, nasihat atau cadangan kewangan, pelaburan, dagangan atau jenis lain yang diberikan atau disahkan oleh TradingView. Baca lebih dalam Terma Penggunaan.
Penerbitan berkaitan
Penafian
Maklumat dan penerbitan adalah tidak bertujuan, dan tidak membentuk, nasihat atau cadangan kewangan, pelaburan, dagangan atau jenis lain yang diberikan atau disahkan oleh TradingView. Baca lebih dalam Terma Penggunaan.