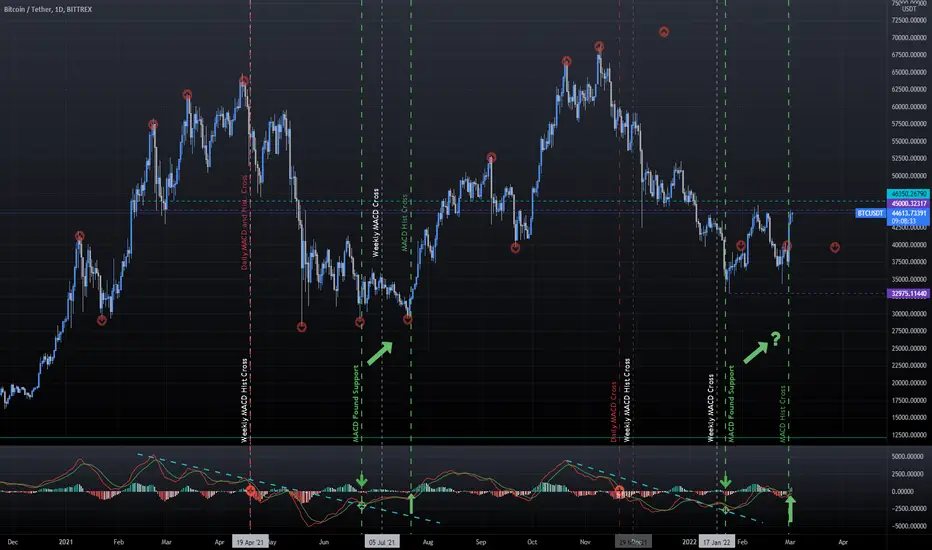
It seems history is repeating.
Weekly MACD histogram and daily MACD and histogram crossing negative preceded the crash in May. Daily MACD finding support, followed by the histogram crossing positive marked the start of the rally in August.
The same sequence of events has just completed in the last few days. Time for a bull run?
Weekly MACD histogram and daily MACD and histogram crossing negative preceded the crash in May. Daily MACD finding support, followed by the histogram crossing positive marked the start of the rally in August.
The same sequence of events has just completed in the last few days. Time for a bull run?

Penafian
Maklumat dan penerbitan adalah tidak bertujuan, dan tidak membentuk, nasihat atau cadangan kewangan, pelaburan, dagangan atau jenis lain yang diberikan atau disahkan oleh TradingView. Baca lebih dalam Terma Penggunaan.
Penafian
Maklumat dan penerbitan adalah tidak bertujuan, dan tidak membentuk, nasihat atau cadangan kewangan, pelaburan, dagangan atau jenis lain yang diberikan atau disahkan oleh TradingView. Baca lebih dalam Terma Penggunaan.