
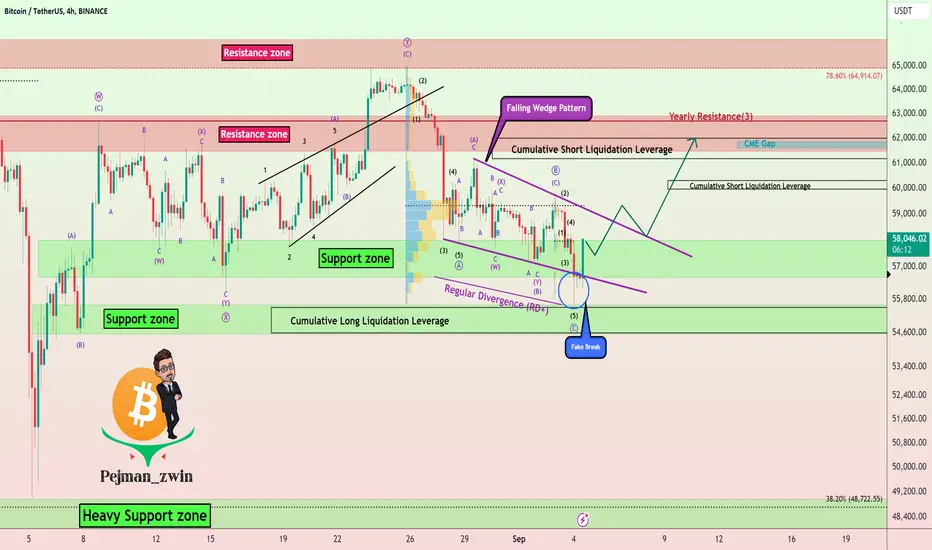
Bitcoin started to rise again after Failing(Fake Break) to break the Support zone($58,000-$56,600).
From the point of view of Classical Technical Analysis, it seems that Bitcoin has formed a Falling Wedge Reversal Pattern, and if the upper line of this pattern breaks, we can expect a further increase in Bitcoin.
From the point of view of Elliott wave theory, Bitcoin's correction waves seem to be continuing. The last corrective wave was the Zigzag Correction(ABC/5-3-5), which was the end of wave C, $55,600.
Also, we can see Regular Divergence(RD+) between Consecutive Valleys.
A head and shoulders pattern could form, causing Bitcoin to decline again to nearly $50,000==Two scenarios are possible👇

I expect Bitcoin to move according to the movements I have outlined in the chart.
Note: If Bitcoin loses the Support zone($58,000-$56,600), we should expect Bitcoin to fall to $51,000(at least).
Bitcoin Analyze (BTCUSDT), 4-hour time frame⏰.
Do not forget to put Stop loss for your positions (For every position you want to open).
Please follow your strategy and updates; this is just my Idea, and I will gladly see your ideas in this post.
Please do not forget the ✅' like'✅ button 🙏😊 & Share it with your friends; thanks, and Trade safe.
From the point of view of Classical Technical Analysis, it seems that Bitcoin has formed a Falling Wedge Reversal Pattern, and if the upper line of this pattern breaks, we can expect a further increase in Bitcoin.
From the point of view of Elliott wave theory, Bitcoin's correction waves seem to be continuing. The last corrective wave was the Zigzag Correction(ABC/5-3-5), which was the end of wave C, $55,600.
Also, we can see Regular Divergence(RD+) between Consecutive Valleys.
A head and shoulders pattern could form, causing Bitcoin to decline again to nearly $50,000==Two scenarios are possible👇
I expect Bitcoin to move according to the movements I have outlined in the chart.
Note: If Bitcoin loses the Support zone($58,000-$56,600), we should expect Bitcoin to fall to $51,000(at least).
Bitcoin Analyze (BTCUSDT), 4-hour time frame⏰.
Do not forget to put Stop loss for your positions (For every position you want to open).
Please follow your strategy and updates; this is just my Idea, and I will gladly see your ideas in this post.
Please do not forget the ✅' like'✅ button 🙏😊 & Share it with your friends; thanks, and Trade safe.
Pesanan dibatalkan
As I mentioned, " if the upper line of this pattern breaks, we can expect a further increase in Bitcoin.&If Bitcoin loses the Support zone($58,000-$56,600), we should expect Bitcoin to fall to $51,000(at least).
You can search for a Short position.

🚀 Up to 75% Trading Fee Rebates Across 20+ Exchanges:
🤖 t.me/Protrader365bot
-----
🎁 Free VIP Forex and Crypto Signals, please visit:
🔗 t.me/ProTrader_365
🤖 t.me/Protrader365bot
-----
🎁 Free VIP Forex and Crypto Signals, please visit:
🔗 t.me/ProTrader_365
Penerbitan berkaitan
Penafian
Maklumat dan penerbitan adalah tidak bertujuan, dan tidak membentuk, nasihat atau cadangan kewangan, pelaburan, dagangan atau jenis lain yang diberikan atau disahkan oleh TradingView. Baca lebih dalam Terma Penggunaan.
🚀 Up to 75% Trading Fee Rebates Across 20+ Exchanges:
🤖 t.me/Protrader365bot
-----
🎁 Free VIP Forex and Crypto Signals, please visit:
🔗 t.me/ProTrader_365
🤖 t.me/Protrader365bot
-----
🎁 Free VIP Forex and Crypto Signals, please visit:
🔗 t.me/ProTrader_365
Penerbitan berkaitan
Penafian
Maklumat dan penerbitan adalah tidak bertujuan, dan tidak membentuk, nasihat atau cadangan kewangan, pelaburan, dagangan atau jenis lain yang diberikan atau disahkan oleh TradingView. Baca lebih dalam Terma Penggunaan.