
Laghari Ema
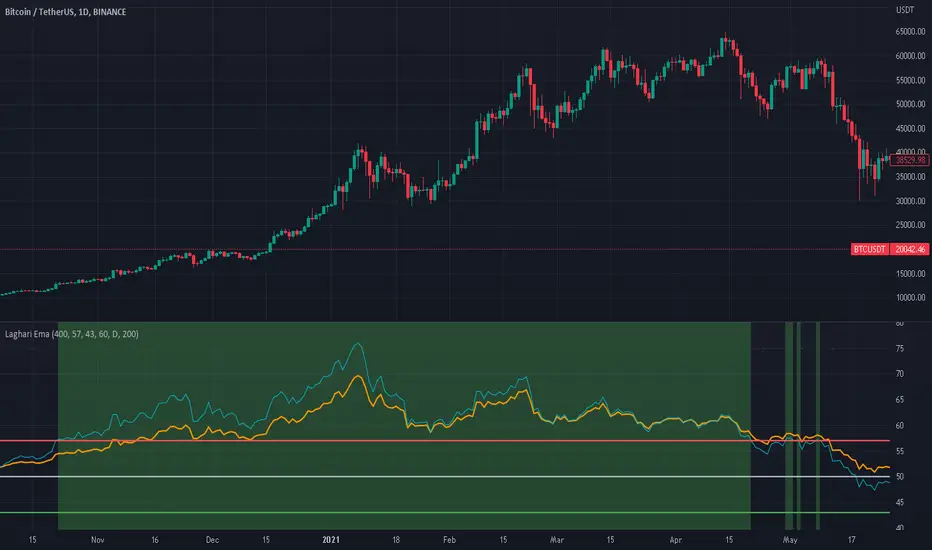
Laghari Ema Contain 2 EMA, Over Sold Level , Over Bought Level and Mid Line With Red, Green Signals,
Ema 1 = Value 400 color Orange,
Ema 2 = Value 200 color Aqua,
When Ema 1 and Ema 2 Both Trending Above the Mid Line Means Market is Bullish,
When Ema 1 and Ema 2 Both Trending Below the Mid Line Means Market is Bearish,
If Ema 2 Aqua is Above the Mid Line And Rising up But Ema 2 Orange Below the Mid Line and don't Crosup then you See a Sharp price drop,
If Ema 2 Aqua is Below the Mid Line And Continue Droping But Ema 2 Orange Above the Mid Line and don't Crosdown then you See a Sharp price Pump,
When Ema 1 and Ema 2 Pinch Together but Don't Cross then you see a reversal applied on Bothe Snerio Bullish and Bearish,
If You see a Continue Red Color That Means Price Continue Dropping
If you See Continue Green Color That Means Price Continue Pumping
Best Results on 1Day Chart Pattern,
This is My Experience Try it Yourself .
Laghari Ema Contain 2 EMA, Over Sold Level , Over Bought Level and Mid Line With Red, Green Signals,
Ema 1 = Value 400 color Orange,
Ema 2 = Value 200 color Aqua,
When Ema 1 and Ema 2 Both Trending Above the Mid Line Means Market is Bullish,
When Ema 1 and Ema 2 Both Trending Below the Mid Line Means Market is Bearish,
If Ema 2 Aqua is Above the Mid Line And Rising up But Ema 2 Orange Below the Mid Line and don't Crosup then you See a Sharp price drop,
If Ema 2 Aqua is Below the Mid Line And Continue Droping But Ema 2 Orange Above the Mid Line and don't Crosdown then you See a Sharp price Pump,
When Ema 1 and Ema 2 Pinch Together but Don't Cross then you see a reversal applied on Bothe Snerio Bullish and Bearish,
If You see a Continue Red Color That Means Price Continue Dropping
If you See Continue Green Color That Means Price Continue Pumping
Best Results on 1Day Chart Pattern,
This is My Experience Try it Yourself .

Penafian
Maklumat dan penerbitan adalah tidak bertujuan, dan tidak membentuk, nasihat atau cadangan kewangan, pelaburan, dagangan atau jenis lain yang diberikan atau disahkan oleh TradingView. Baca lebih dalam Terma Penggunaan.
Penafian
Maklumat dan penerbitan adalah tidak bertujuan, dan tidak membentuk, nasihat atau cadangan kewangan, pelaburan, dagangan atau jenis lain yang diberikan atau disahkan oleh TradingView. Baca lebih dalam Terma Penggunaan.