
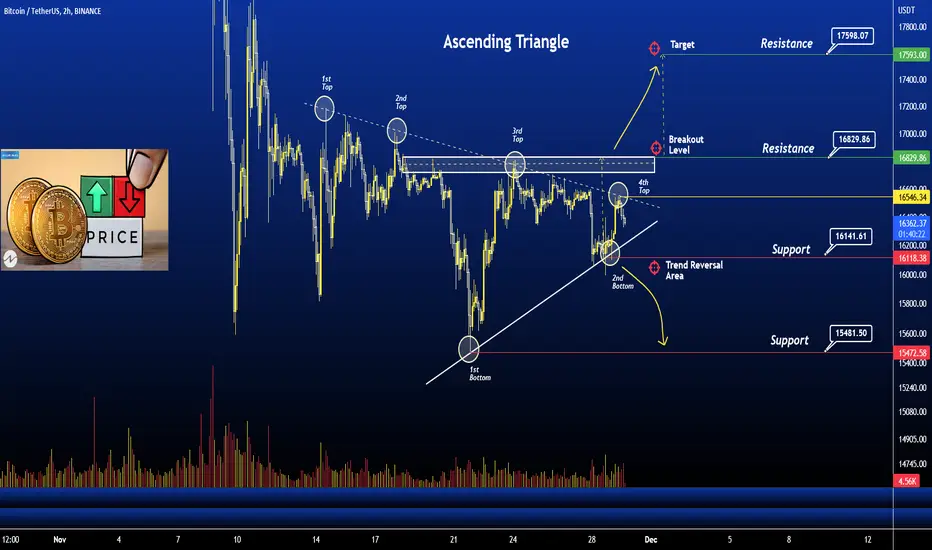
BTC "Ascending Triangle" Breakout
The ascending triangle is a characteristic pattern of an ongoing bullish trend . This triangle is formed by a horizontal upper trend line that connects the highs and the lower trend line that connects the rising lows. If the trend breaks out at the resistance level , the price will continue to move up in this ascending triangle pattern.
Currently, Bitcoin is in the range of $16370. If the pattern continues, the price of HT might reach the resistance levels of $17600 . If the trend reverses, then the price of HT may fall to $15500
Happy Trading
The ascending triangle is a characteristic pattern of an ongoing bullish trend . This triangle is formed by a horizontal upper trend line that connects the highs and the lower trend line that connects the rising lows. If the trend breaks out at the resistance level , the price will continue to move up in this ascending triangle pattern.
Currently, Bitcoin is in the range of $16370. If the pattern continues, the price of HT might reach the resistance levels of $17600 . If the trend reverses, then the price of HT may fall to $15500
Happy Trading
Dagangan aktif
Dagangan aktif
Nota
Breakout done
Dagangan aktif
Nota
Bitcoin is on FireDagangan aktif
17100+Dagangan ditutup: sasaran tercapai

Penerbitan berkaitan
Penafian
Maklumat dan penerbitan adalah tidak bertujuan, dan tidak membentuk, nasihat atau cadangan kewangan, pelaburan, dagangan atau jenis lain yang diberikan atau disahkan oleh TradingView. Baca lebih dalam Terma Penggunaan.
Penerbitan berkaitan
Penafian
Maklumat dan penerbitan adalah tidak bertujuan, dan tidak membentuk, nasihat atau cadangan kewangan, pelaburan, dagangan atau jenis lain yang diberikan atau disahkan oleh TradingView. Baca lebih dalam Terma Penggunaan.