
Hello everyone! If you enjoy this content, please consider giving it a like and following for more updates.
Welcome to your BTC/USDT Quick Update!
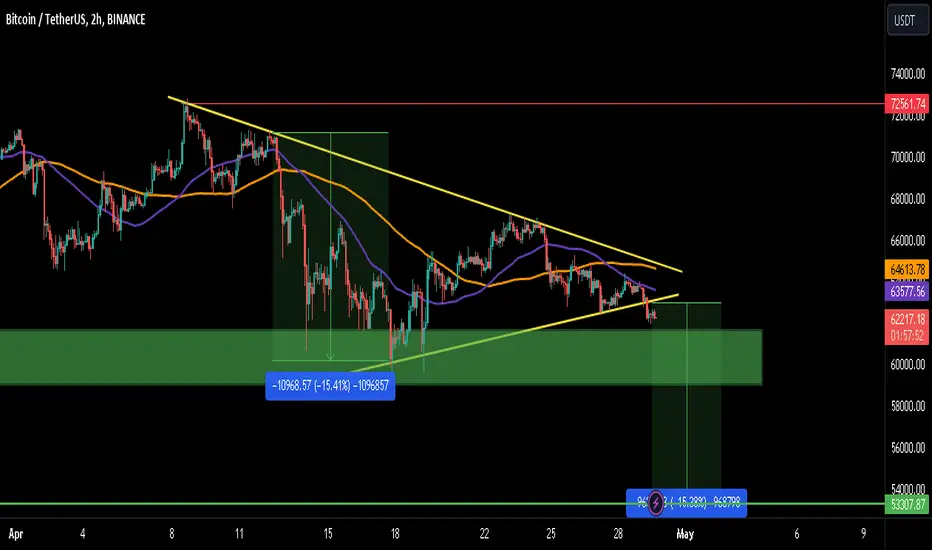
The chart on a lower timeframe shows a breakout from the symmetrical triangle, indicating a potential bearish trend. However, strong support sits at the $59,000-$60,000 level. We might see a bounce from there. If we break below this support, there's a high chance of visiting the $52,000-$53,000 level.
What do you think about this?
Share your views in the comment section.
Thank You!
Welcome to your BTC/USDT Quick Update!
The chart on a lower timeframe shows a breakout from the symmetrical triangle, indicating a potential bearish trend. However, strong support sits at the $59,000-$60,000 level. We might see a bounce from there. If we break below this support, there's a high chance of visiting the $52,000-$53,000 level.
What do you think about this?
Share your views in the comment section.
Thank You!

Penerbitan berkaitan
Penafian
Maklumat dan penerbitan adalah tidak bertujuan, dan tidak membentuk, nasihat atau cadangan kewangan, pelaburan, dagangan atau jenis lain yang diberikan atau disahkan oleh TradingView. Baca lebih dalam Terma Penggunaan.
Penerbitan berkaitan
Penafian
Maklumat dan penerbitan adalah tidak bertujuan, dan tidak membentuk, nasihat atau cadangan kewangan, pelaburan, dagangan atau jenis lain yang diberikan atau disahkan oleh TradingView. Baca lebih dalam Terma Penggunaan.