
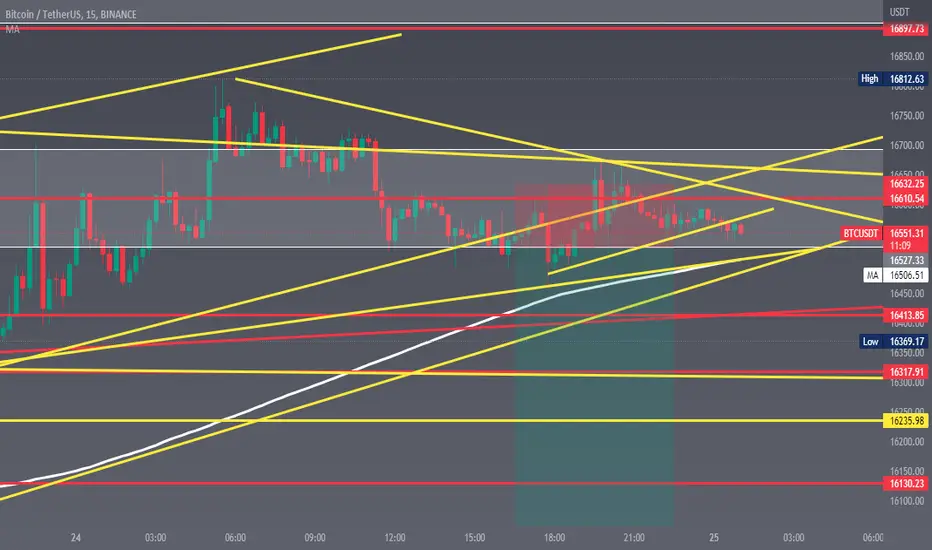
BTC New Target
Bear vs Bull
Once again we look at Bitcoin (XBT) short-term.
We have a recent bullish move... What happens next?
Above the blue and grey lines the bullish move can continue.
Immediate resistance is also found at the black line or MA200 ($16,483).
Looking at these three levels, XBT needs to move above the $16,500/$16,850 price range to knock out the bears.
Any trading below the blue line (~$16,615) can keep the bears alive and the drop resume.
If this level are conquered, then the balls passes towards the bulls.
More details on the chart.
Still red...
Namaste.

Penafian
Maklumat dan penerbitan adalah tidak bertujuan, dan tidak membentuk, nasihat atau cadangan kewangan, pelaburan, dagangan atau jenis lain yang diberikan atau disahkan oleh TradingView. Baca lebih dalam Terma Penggunaan.
Penafian
Maklumat dan penerbitan adalah tidak bertujuan, dan tidak membentuk, nasihat atau cadangan kewangan, pelaburan, dagangan atau jenis lain yang diberikan atau disahkan oleh TradingView. Baca lebih dalam Terma Penggunaan.