
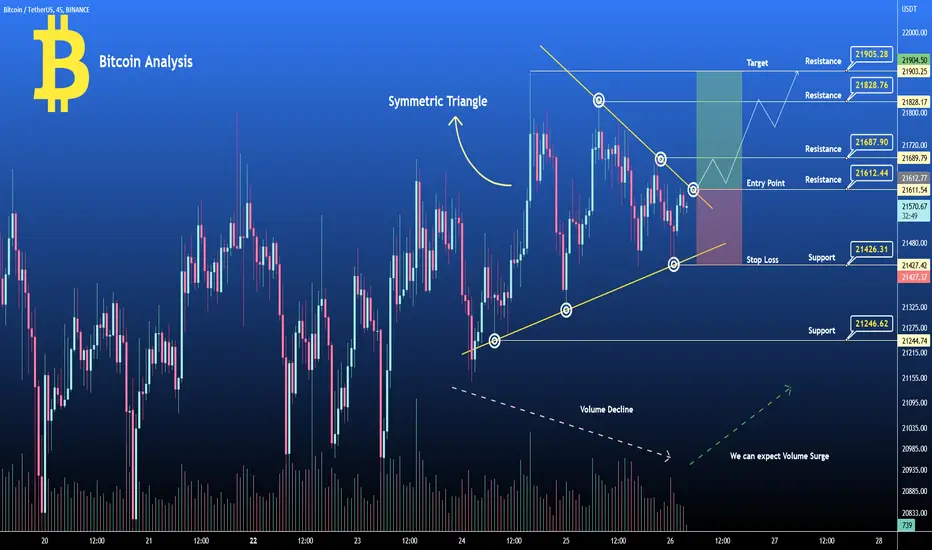
The above chart of Bitcoin ( BTCUSDT ) laid out the Symmetric triangle pattern. Currently, Bitcoin ( BTCUSDT ) is in the range of $21580. If the pattern continues, the price of Bitcoin ( BTCUSDT ) might reach the resistance levels of $21900, If the trend reverses, then the price of Bitcoin ( BTCUSDT ) may fall to $21420
RSI - Below 50
Trade Level
Buy Entry : $21615
Target : $21900
Stop Loss : $21420
Happy Trading $$$$
RSI - Below 50
Trade Level
Buy Entry : $21615
Target : $21900
Stop Loss : $21420
Happy Trading $$$$
Nota
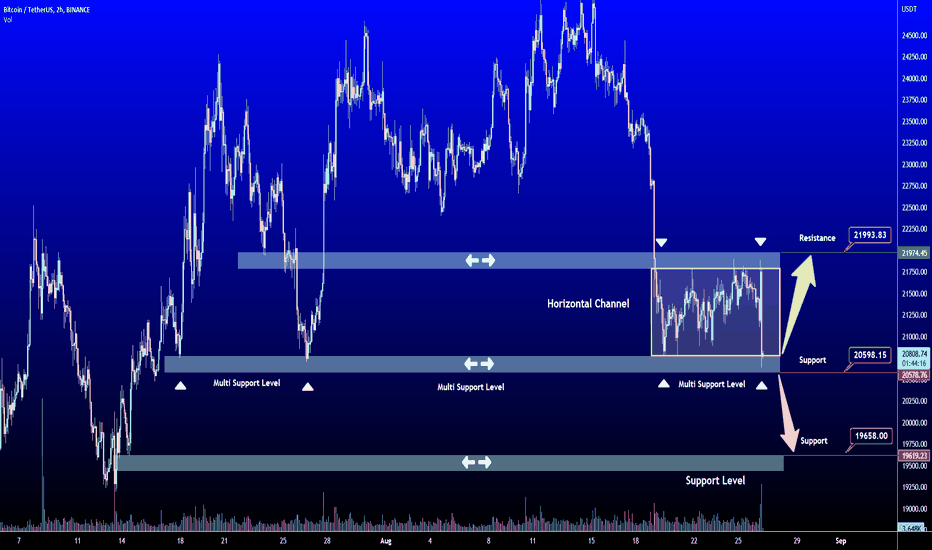
Nota
Fresh View Above
Penerbitan berkaitan
Penafian
Maklumat dan penerbitan adalah tidak bertujuan, dan tidak membentuk, nasihat atau cadangan kewangan, pelaburan, dagangan atau jenis lain yang diberikan atau disahkan oleh TradingView. Baca lebih dalam Terma Penggunaan.
Penerbitan berkaitan
Penafian
Maklumat dan penerbitan adalah tidak bertujuan, dan tidak membentuk, nasihat atau cadangan kewangan, pelaburan, dagangan atau jenis lain yang diberikan atau disahkan oleh TradingView. Baca lebih dalam Terma Penggunaan.