
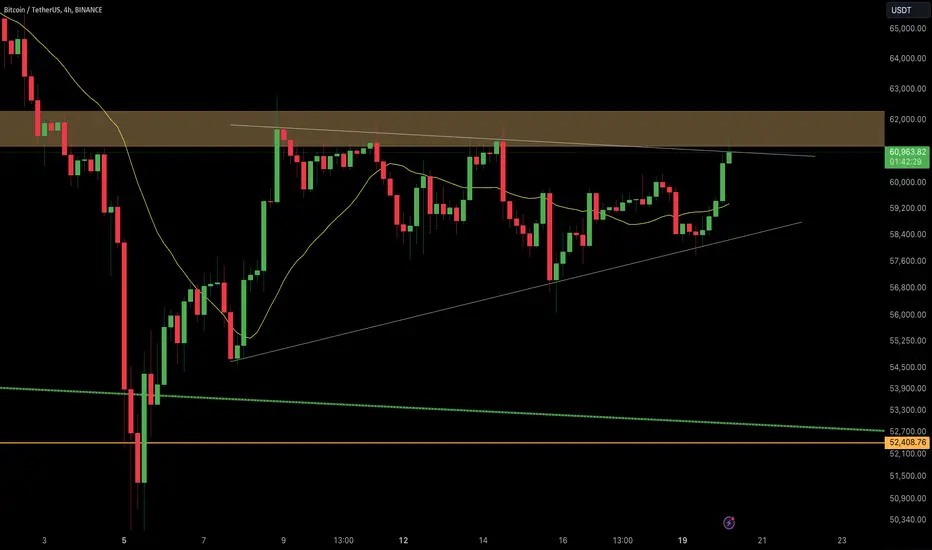
BTC/USDT is testing a crucial resistance zone around $61,400 – $62,000 within an ascending triangle pattern. A successful breakout above this level could lead to a continuation of the uptrend. However, if the price fails to break out, a return to support levels around $58,400 or $52,408 could occur. Traders should monitor volume for confirmation of any breakout.
BTC/USDT 4-hour chart, focusing on key support and resistance levels, moving averages, and chart patterns.
Remember: This is not financial advice. Stay tuned to us for further updates and analysis. Thank you!
BTC/USDT 4-hour chart, focusing on key support and resistance levels, moving averages, and chart patterns.
Remember: This is not financial advice. Stay tuned to us for further updates and analysis. Thank you!

Penerbitan berkaitan
Penafian
Maklumat dan penerbitan adalah tidak bertujuan, dan tidak membentuk, nasihat atau cadangan kewangan, pelaburan, dagangan atau jenis lain yang diberikan atau disahkan oleh TradingView. Baca lebih dalam Terma Penggunaan.
Penerbitan berkaitan
Penafian
Maklumat dan penerbitan adalah tidak bertujuan, dan tidak membentuk, nasihat atau cadangan kewangan, pelaburan, dagangan atau jenis lain yang diberikan atau disahkan oleh TradingView. Baca lebih dalam Terma Penggunaan.