
Apoorv Dubey | SEBI Registered Research Analyst
What happens after a stock breaks out of a long-term base? That’s the part of the chart I find most interesting.
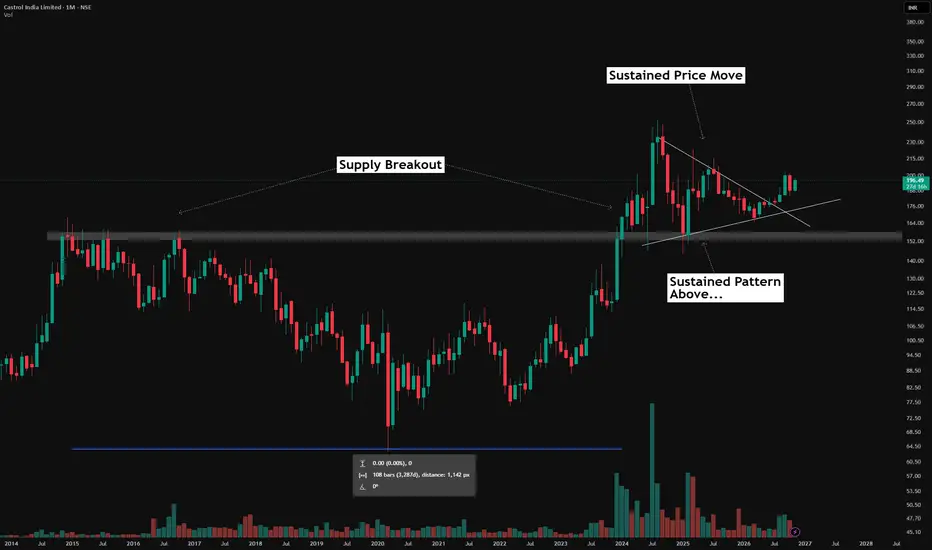
On Castrol India’s monthly timeframe, the grey band marks a historical supply area. The chart shows a broad, cup-like structure spanning more than 3,200 days before price moved above this zone.
The breakout was followed by a strong advance. But rather than focus only on that initial move, I like to study what happens after price pauses:
The breakout: Price moved above the grey supply zone after years below it.
The retracement: Following the advance, price corrected back towards the former resistance area.
The consolidation: Price then developed a converging structure, with a descending upper boundary and a rising lower boundary—a symmetrical triangle-like pattern.
The bigger picture: The subsequent structure has developed largely above the old supply zone. The chart also shows temporary moves below the band, so it is better viewed as an area than an exact line.
This is the price action I like to observe: a major move, followed by a pause, retracement and a new structure. It gives me time to study how price behaves around an important historical zone.
For educational purposes only. This is not a recommendation to buy, sell or hold any security. Chart patterns and support zones do not guarantee future outcomes.
What happens after a stock breaks out of a long-term base? That’s the part of the chart I find most interesting.
On Castrol India’s monthly timeframe, the grey band marks a historical supply area. The chart shows a broad, cup-like structure spanning more than 3,200 days before price moved above this zone.
The breakout was followed by a strong advance. But rather than focus only on that initial move, I like to study what happens after price pauses:
The breakout: Price moved above the grey supply zone after years below it.
The retracement: Following the advance, price corrected back towards the former resistance area.
The consolidation: Price then developed a converging structure, with a descending upper boundary and a rising lower boundary—a symmetrical triangle-like pattern.
The bigger picture: The subsequent structure has developed largely above the old supply zone. The chart also shows temporary moves below the band, so it is better viewed as an area than an exact line.
This is the price action I like to observe: a major move, followed by a pause, retracement and a new structure. It gives me time to study how price behaves around an important historical zone.
For educational purposes only. This is not a recommendation to buy, sell or hold any security. Chart patterns and support zones do not guarantee future outcomes.

📊Swing & positional research with Buy, Sell & Hold recommendations
Contact for NOVEMBER SLOTS
📞WhatsApp ( Pro ): wa.me/919455664601
📢Free Picks on Telegram ( Join ) : t.me/hashtaghammer
Apoorv Dubey|SEBI RA INH000030287
Contact for NOVEMBER SLOTS
📞WhatsApp ( Pro ): wa.me/919455664601
📢Free Picks on Telegram ( Join ) : t.me/hashtaghammer
Apoorv Dubey|SEBI RA INH000030287
Penerbitan berkaitan
Penafian
Maklumat dan penerbitan adalah tidak bertujuan, dan tidak membentuk, nasihat atau cadangan kewangan, pelaburan, dagangan atau jenis lain yang diberikan atau disahkan oleh TradingView. Baca lebih dalam Terma Penggunaan.
📊Swing & positional research with Buy, Sell & Hold recommendations
Contact for NOVEMBER SLOTS
📞WhatsApp ( Pro ): wa.me/919455664601
📢Free Picks on Telegram ( Join ) : t.me/hashtaghammer
Apoorv Dubey|SEBI RA INH000030287
Contact for NOVEMBER SLOTS
📞WhatsApp ( Pro ): wa.me/919455664601
📢Free Picks on Telegram ( Join ) : t.me/hashtaghammer
Apoorv Dubey|SEBI RA INH000030287
Penerbitan berkaitan
Penafian
Maklumat dan penerbitan adalah tidak bertujuan, dan tidak membentuk, nasihat atau cadangan kewangan, pelaburan, dagangan atau jenis lain yang diberikan atau disahkan oleh TradingView. Baca lebih dalam Terma Penggunaan.