
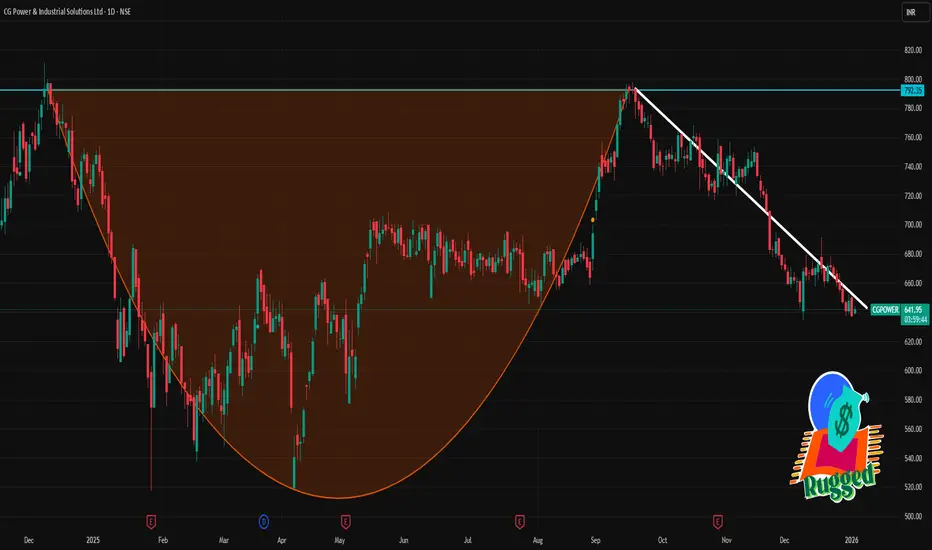
📊 Daily Price Levels (1D Time Frame)
Current price range (recent session)
• Day’s trading range ~ ₹634–₹651 approx on NSE (latest close ~ ₹637–₹647) (as per recent data)
Pivot / Pivot‑based levels
• Daily Pivot: ~ ₹662 (central reference)
(use this as a neutral baseline — above favors bullish bias, below favors bearish bias)
Immediate Resistance
1️⃣ R1 ~ ₹665–₹668 (zone of immediate selling pressure)
2️⃣ R2 ~ ₹675–₹680 (next upside barrier)
3️⃣ Higher resistance (secondary) ~ ₹685–₹695+ (seen in other pivot data)
Immediate Support
1️⃣ S1 ~ ₹656–₹650 (first support zone)
2️⃣ S2 ~ ₹644–₹640 (next downside support)
3️⃣ S3 ~ ₹627–₹630 (deeper support)
📌 Interpretation (1‑Day)
If price holds above ₹656–₹650, the bias may stabilize and test ₹665–₹675 on the upside.
Break below ₹640–₹630 increases risk of further weakness in the short run.
Daily pivot at ~₹662 helps gauge short‑term trend — sustaining above it hints at short‑term buying interest, below it suggests continued pressure.
(These levels are typical pivot/sr zones used by traders; use live charts for exact current quotes.)
🧠 Extra Context (Technical Indicators)
Short‑term technical indicators (RSI & moving averages) have shown mixed to bearish signals recently, with several daily sell signals noted in external analysis.
Current price range (recent session)
• Day’s trading range ~ ₹634–₹651 approx on NSE (latest close ~ ₹637–₹647) (as per recent data)
Pivot / Pivot‑based levels
• Daily Pivot: ~ ₹662 (central reference)
(use this as a neutral baseline — above favors bullish bias, below favors bearish bias)
Immediate Resistance
1️⃣ R1 ~ ₹665–₹668 (zone of immediate selling pressure)
2️⃣ R2 ~ ₹675–₹680 (next upside barrier)
3️⃣ Higher resistance (secondary) ~ ₹685–₹695+ (seen in other pivot data)
Immediate Support
1️⃣ S1 ~ ₹656–₹650 (first support zone)
2️⃣ S2 ~ ₹644–₹640 (next downside support)
3️⃣ S3 ~ ₹627–₹630 (deeper support)
📌 Interpretation (1‑Day)
If price holds above ₹656–₹650, the bias may stabilize and test ₹665–₹675 on the upside.
Break below ₹640–₹630 increases risk of further weakness in the short run.
Daily pivot at ~₹662 helps gauge short‑term trend — sustaining above it hints at short‑term buying interest, below it suggests continued pressure.
(These levels are typical pivot/sr zones used by traders; use live charts for exact current quotes.)
🧠 Extra Context (Technical Indicators)
Short‑term technical indicators (RSI & moving averages) have shown mixed to bearish signals recently, with several daily sell signals noted in external analysis.

Contact Knowledgehub for a detailed consultation: Dm on WhatsApp: [wa.link/a2o0kz]-
Phone No: [+91 93102 26243]-
Email: [tradingviewknowledgehub@gmail.com]---
-- Let’s achieve success together!
Phone No: [+91 93102 26243]-
Email: [tradingviewknowledgehub@gmail.com]---
-- Let’s achieve success together!
Penerbitan berkaitan
Penafian
Maklumat dan penerbitan adalah tidak bertujuan, dan tidak membentuk, nasihat atau cadangan kewangan, pelaburan, dagangan atau jenis lain yang diberikan atau disahkan oleh TradingView. Baca lebih dalam Terma Penggunaan.
Contact Knowledgehub for a detailed consultation: Dm on WhatsApp: [wa.link/a2o0kz]-
Phone No: [+91 93102 26243]-
Email: [tradingviewknowledgehub@gmail.com]---
-- Let’s achieve success together!
Phone No: [+91 93102 26243]-
Email: [tradingviewknowledgehub@gmail.com]---
-- Let’s achieve success together!
Penerbitan berkaitan
Penafian
Maklumat dan penerbitan adalah tidak bertujuan, dan tidak membentuk, nasihat atau cadangan kewangan, pelaburan, dagangan atau jenis lain yang diberikan atau disahkan oleh TradingView. Baca lebih dalam Terma Penggunaan.