
CHENNPETRO Descending Triangle Breakout with Exceptional Volume
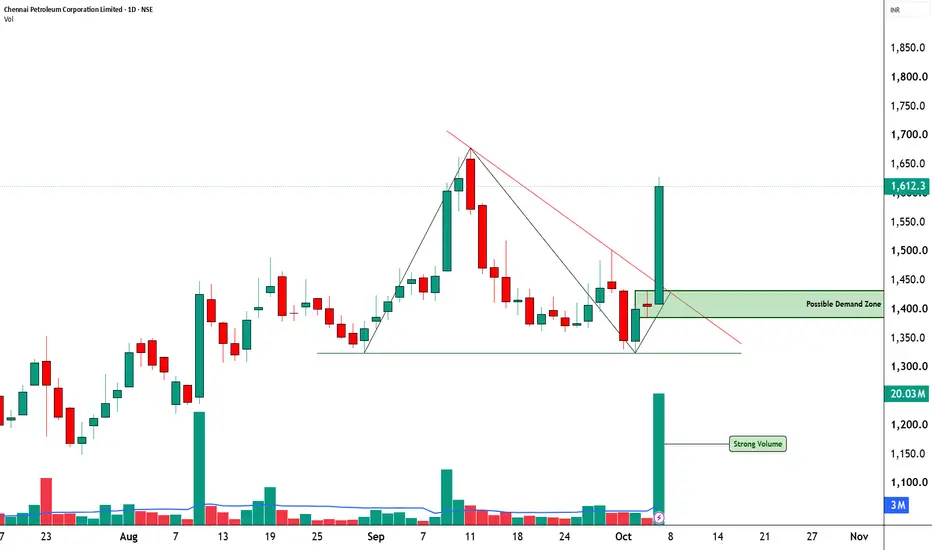
🔥 Chennai Petroleum: Descending Triangle Breakout with Exceptional Volume
📊 MARKET STRUCTURE SNAPSHOT | NSE: CHENNPETRO | DAILY
Closing Price: 1,612.30
Core Trend: Uptrend
Market State: Strong Bullish Expansion / Breakout
Chart Pattern: Descending Triangle — Bullish Breakout
Candlestick Pattern: Strong Bullish Candle
Price Structure: Price had been consolidating below a descending resistance line after the earlier rejection near the 1,650–1,680 zone. The latest session has produced a powerful expansion through that resistance, closing at 1,612.30 and shifting the short-term structure decisively higher.
Technicals: Strong Bullish Momentum
Volume: 20.03M vs 3.00M average — approximately 6.67× average
Moving Average Structure: Full Bullish EMA Stack
CPR & Market Structure: Bullish Zone — Narrow CPR
Range Status: NR4 Active — Watch for Breakout
Next Session CPR: Wide — Pivot 1,550.30 | Top 1,581.30 | Base 1,519.30
Model Reference: 1,628.70
Observation Reference: 1,936.40
Resistance References: 1,690.67 | 1,769.03 | 1,909.37
Support References: 1,471.97 | 1,331.63 | 1,253.27
📚 STWP EDUCATIONAL OBSERVATION
Chennai Petroleum has delivered a significant technical expansion from the descending triangle structure, with the latest session closing at 1,612.30, up 14.70%. The clean daily chart shows price breaking above the descending resistance line after a period of consolidation, while volume expanded dramatically to approximately 20.03M, compared with an average of around 3.00M, representing nearly 6.67× average participation. Price is trading above VWAP at 1,550.33 and above the complete EMA structure, with the 9, 21, 50, 100 and 200-period averages maintaining bullish alignment. RSI at 66.56 reflects strong momentum, while the latest expansion candle has carried price well above the recent consolidation zone. The immediate 1,690.67 reference is now an important area for studying subsequent price behaviour, with 1,471.97 providing a broader structural reference below. The 15-minute chart also shows price holding above the 1,540–1,550 demand zone after the sharp expansion, adding short-term context to the daily breakout.
📚 STWP EDUCATIONAL NOTE
This content is provided strictly for educational and informational purposes only.
The information presented should not be construed as investment advice, research advice, financial advice, a recommendation, solicitation or an offer to buy, sell or hold any security.
Technical analysis and historical price behaviour cannot guarantee or predict future market performance. STWP and the author make no representation or guarantee regarding future price movements, returns, performance or outcomes. Past performance is not indicative of future results.
Kindly consult an appropriately SEBI-registered investment professional.
📊 MARKET STRUCTURE SNAPSHOT | NSE: CHENNPETRO | DAILY
Closing Price: 1,612.30
Core Trend: Uptrend
Market State: Strong Bullish Expansion / Breakout
Chart Pattern: Descending Triangle — Bullish Breakout
Candlestick Pattern: Strong Bullish Candle
Price Structure: Price had been consolidating below a descending resistance line after the earlier rejection near the 1,650–1,680 zone. The latest session has produced a powerful expansion through that resistance, closing at 1,612.30 and shifting the short-term structure decisively higher.
Technicals: Strong Bullish Momentum
Volume: 20.03M vs 3.00M average — approximately 6.67× average
Moving Average Structure: Full Bullish EMA Stack
CPR & Market Structure: Bullish Zone — Narrow CPR
Range Status: NR4 Active — Watch for Breakout
Next Session CPR: Wide — Pivot 1,550.30 | Top 1,581.30 | Base 1,519.30
Model Reference: 1,628.70
Observation Reference: 1,936.40
Resistance References: 1,690.67 | 1,769.03 | 1,909.37
Support References: 1,471.97 | 1,331.63 | 1,253.27
📚 STWP EDUCATIONAL OBSERVATION
Chennai Petroleum has delivered a significant technical expansion from the descending triangle structure, with the latest session closing at 1,612.30, up 14.70%. The clean daily chart shows price breaking above the descending resistance line after a period of consolidation, while volume expanded dramatically to approximately 20.03M, compared with an average of around 3.00M, representing nearly 6.67× average participation. Price is trading above VWAP at 1,550.33 and above the complete EMA structure, with the 9, 21, 50, 100 and 200-period averages maintaining bullish alignment. RSI at 66.56 reflects strong momentum, while the latest expansion candle has carried price well above the recent consolidation zone. The immediate 1,690.67 reference is now an important area for studying subsequent price behaviour, with 1,471.97 providing a broader structural reference below. The 15-minute chart also shows price holding above the 1,540–1,550 demand zone after the sharp expansion, adding short-term context to the daily breakout.
📚 STWP EDUCATIONAL NOTE
This content is provided strictly for educational and informational purposes only.
The information presented should not be construed as investment advice, research advice, financial advice, a recommendation, solicitation or an offer to buy, sell or hold any security.
Technical analysis and historical price behaviour cannot guarantee or predict future market performance. STWP and the author make no representation or guarantee regarding future price movements, returns, performance or outcomes. Past performance is not indicative of future results.
Kindly consult an appropriately SEBI-registered investment professional.

STWP | Mentor & Demand-Supply Specialist |
Empowering traders through structured learning |
simpletradewithpatience.com
chat.whatsapp.com/CpgyHCfioQ5Hxf7rd8pDqw
wa.me/message/6IOPHGOXMGZ4N1
Educational Only
Empowering traders through structured learning |
simpletradewithpatience.com
chat.whatsapp.com/CpgyHCfioQ5Hxf7rd8pDqw
wa.me/message/6IOPHGOXMGZ4N1
Educational Only
Penafian
Maklumat dan penerbitan adalah tidak bertujuan, dan tidak membentuk, nasihat atau cadangan kewangan, pelaburan, dagangan atau jenis lain yang diberikan atau disahkan oleh TradingView. Baca lebih dalam Terma Penggunaan.
STWP | Mentor & Demand-Supply Specialist |
Empowering traders through structured learning |
simpletradewithpatience.com
chat.whatsapp.com/CpgyHCfioQ5Hxf7rd8pDqw
wa.me/message/6IOPHGOXMGZ4N1
Educational Only
Empowering traders through structured learning |
simpletradewithpatience.com
chat.whatsapp.com/CpgyHCfioQ5Hxf7rd8pDqw
wa.me/message/6IOPHGOXMGZ4N1
Educational Only
Penafian
Maklumat dan penerbitan adalah tidak bertujuan, dan tidak membentuk, nasihat atau cadangan kewangan, pelaburan, dagangan atau jenis lain yang diberikan atau disahkan oleh TradingView. Baca lebih dalam Terma Penggunaan.