

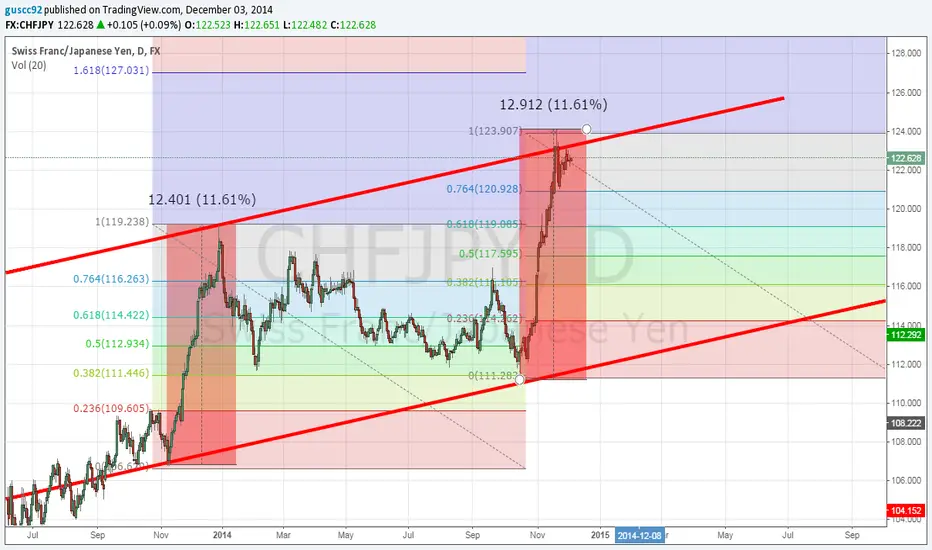
There is a marked long trend tendency with similar resistance and support lines.
Inside that, we can see how the bullish price is strong and has had a retracement of 61.8%.
Both fibonacci are exactly the same, and as we can see, the story seems to repeat.
We can also see how both range have exactly the same % with very similar price unit ranges.
Inside that, we can see how the bullish price is strong and has had a retracement of 61.8%.
Both fibonacci are exactly the same, and as we can see, the story seems to repeat.
We can also see how both range have exactly the same % with very similar price unit ranges.

Penafian
Maklumat dan penerbitan adalah tidak bertujuan, dan tidak membentuk, nasihat atau cadangan kewangan, pelaburan, dagangan atau jenis lain yang diberikan atau disahkan oleh TradingView. Baca lebih dalam Terma Penggunaan.
Penafian
Maklumat dan penerbitan adalah tidak bertujuan, dan tidak membentuk, nasihat atau cadangan kewangan, pelaburan, dagangan atau jenis lain yang diberikan atau disahkan oleh TradingView. Baca lebih dalam Terma Penggunaan.