
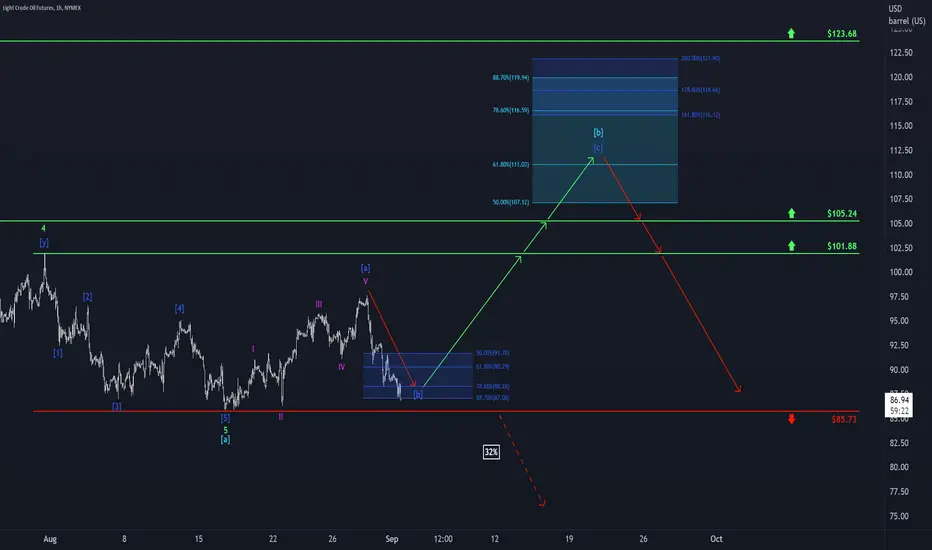
Can you hear WTI’s brakes screeching from the chart? Well, we definitely can! Quite vehemently, WTI has hit the brakes just short of the bottom of the blue zone between $91.70 and $87.08 – and rightly so! There isn’t all that much room left to finish wave b in blue! In fact, WTI should complete it no later than the support at $85.73. Then, it should turn around and climb upwards, gradually crossing the resistances at $101.88 and at $105.24 to enter the turquoise zone between $107.12 and $119.94. There, it should finish wave b in turquoise, before moving downwards again. However, there is a 32% chance that WTI could drop below the support at $85.73, which would then trigger further descent.

📊 Daily market insights combining macro + Elliott Wave analysis
🚀 Spot trends early with momentum, sentiment & price structure
🌐 Join thousands trading smarter at hkcmglobal.com
🚀 Spot trends early with momentum, sentiment & price structure
🌐 Join thousands trading smarter at hkcmglobal.com
Penerbitan berkaitan
Penafian
Maklumat dan penerbitan adalah tidak bertujuan, dan tidak membentuk, nasihat atau cadangan kewangan, pelaburan, dagangan atau jenis lain yang diberikan atau disahkan oleh TradingView. Baca lebih dalam Terma Penggunaan.
📊 Daily market insights combining macro + Elliott Wave analysis
🚀 Spot trends early with momentum, sentiment & price structure
🌐 Join thousands trading smarter at hkcmglobal.com
🚀 Spot trends early with momentum, sentiment & price structure
🌐 Join thousands trading smarter at hkcmglobal.com
Penerbitan berkaitan
Penafian
Maklumat dan penerbitan adalah tidak bertujuan, dan tidak membentuk, nasihat atau cadangan kewangan, pelaburan, dagangan atau jenis lain yang diberikan atau disahkan oleh TradingView. Baca lebih dalam Terma Penggunaan.